
Democrats have won control of both houses of Congress in the 2026 midterm elections. It is a major victory and a clear rejection of the direction taken by President Donald Trump and the Republican Party.
The Associated Press reports that Democrats captured both the House and Senate, creating divided government for the final two years of Trump’s presidency.
As of 4 November, networks have projected Democratic control of both chambers; several Senate races remain close and results are not certified.
But history warns us against confusing an electoral victory with durable political power. Winning an election is an event. Building a coalition capable of governing, surviving political opposition, and improving ordinary people’s lives is a much larger project.
The history of the Democratic Party shows that its power was most durable when it rested on an organized coalition of workers, unions, progressive politicians, civil-rights organizations, and working-class communities. When that institutional foundation weakened, Democratic victories became less capable of producing lasting reform.
The lesson of the midterms is therefore not simply that Democrats can defeat Republicans. The real question is whether Democrats will use this victory to rebuild political power among working people.
The coalition must therefore be reciprocal:
A labor–political coalition remains durable only when elected leaders deliver enforceable rights and material gains for workers, and when organized labor remains independent enough to hold those leaders accountable.
Without political protection, workers face enormous obstacles when attempting to organize. But without independent worker organization, progressive politicians lose the social foundation required to overcome corporate pressure and transform campaign promises into law. Politicians need organized workers, and organized workers need a government that protects democratic power in the workplace. Neither side can build durable reform alone.
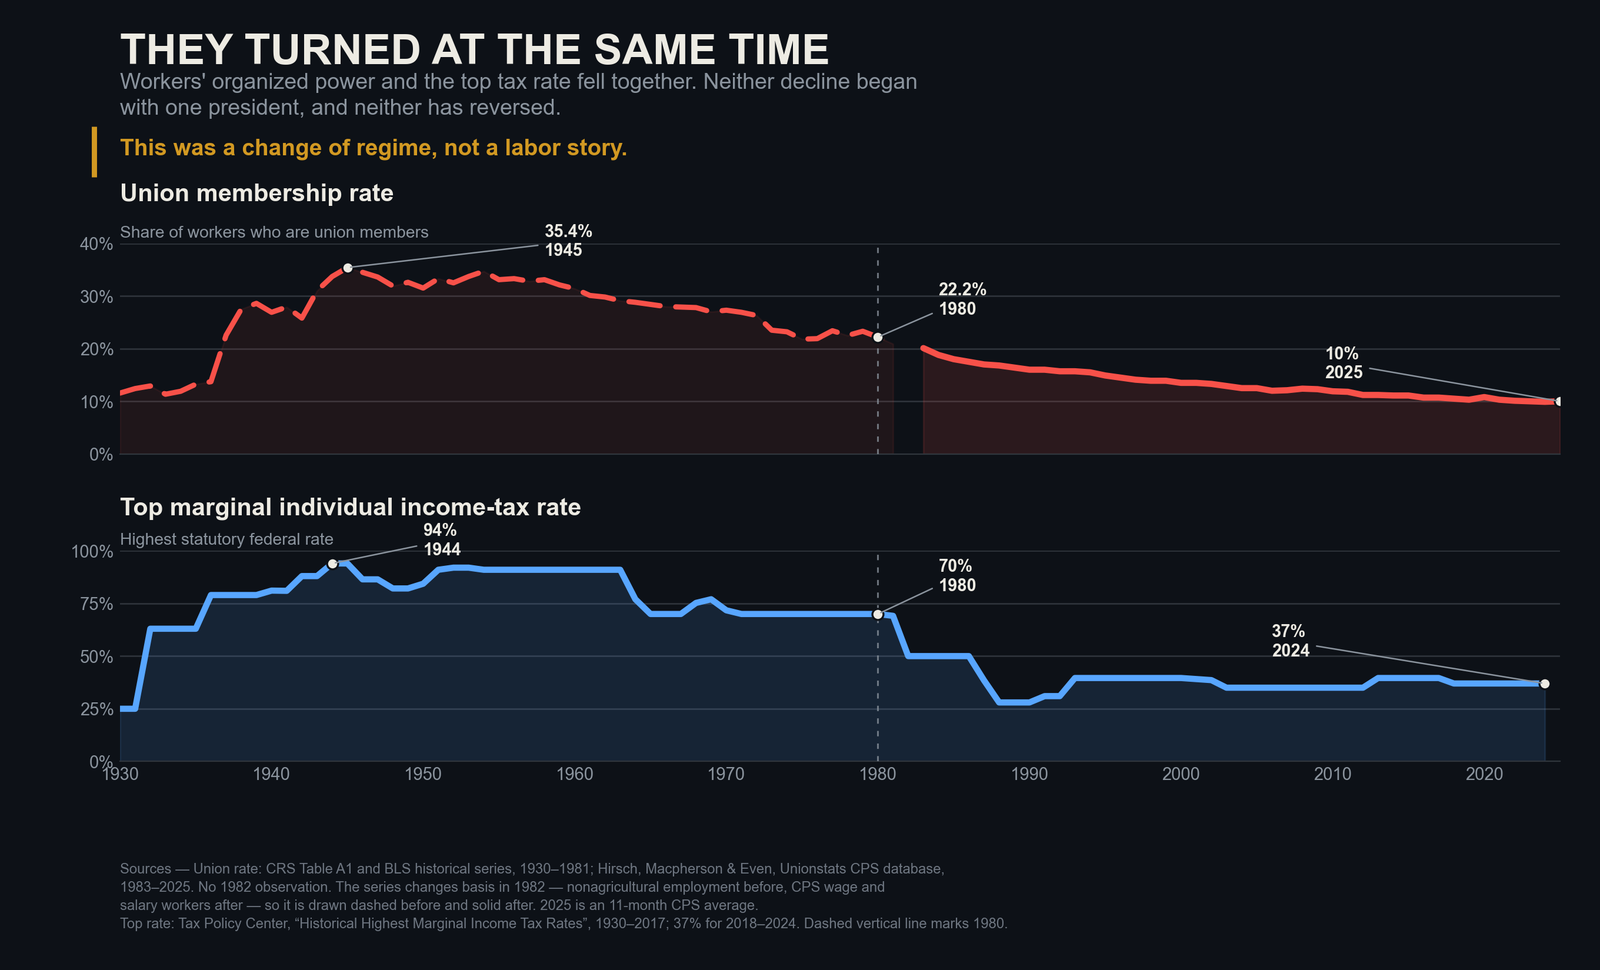
The decline started long before Reagan
Source: Union rate: CRS Table A1 and BLS historical series, 1930–1981; Hirsch, Macpherson & Even, Unionstats CPS database, 1983–2025. Top rate: Tax Policy Center, “Historical Highest Marginal Income Tax Rates”, 1930–2017; 37% for 2018–2024.
Figure 1 shows the union membership rate in the United States from 1930 to 2025.
In 1933, only about 11 percent of nonagricultural workers belonged to unions. During the New Deal period, union membership rose dramatically. By 1945, approximately 35 percent of workers were union members. By 2025, only 10 percent of American wage-and-salary workers belonged to unions. The country had approximately 14.7 million union members, even though its workforce was far larger than it had been during the postwar period.
These modern estimates come from the Bureau of Labor Statistics; the longer historical series combines BLS and Congressional Research Service data with the Union Membership and Coverage Database.
But look at where the fall happened (Figure 1). Union density dropped 14.5 points between its 1945 peak and 1981 — the year Ronald Reagan dismissed the striking air-traffic controllers. It has fallen 10.9 points in the forty-four years since. More of the decline happened before Reagan than after him.
That single comparison rules out the most common explanation on offer this week. Whatever dismantled organized labor in America, it was not one president, and it did not begin in 1981.
What actually built the coalition
This transformation did not happen because politicians generously handed power to workers. Workers organized, struck, and demanded recognition. But political decisions determined whether those efforts would be protected or crushed.
Franklin D. Roosevelt’s administration and the Democratic Congress adopted the Wagner Act in 1935. It established federal protection for workers seeking to organize and bargain collectively. Union growth then accelerated, and organized labor became one of the central institutions of the emerging New Deal coalition.
That coalition helped produce more than electoral victories. It created Social Security, labor protections, public investment, stronger wages, and a political system in which working people possessed organizations capable of representing them between elections.
It is worth being precise about what that meant, because the numbers are larger than the memory of them (Table 1).
| 1945 | 1980 | latest | |
|---|---|---|---|
| Union membership rate | 35.4% | 22.2% | 10.0% (2025) |
| Top marginal income-tax rate | 94% | 70% | 37% (2024) |
| Share of income going to the top 1% | 12.5% | 10.0% | 22.4% (2024) |
At the height of the coalition’s power, the top statutory rate on the highest incomes was 94 percent, and the richest one percent of Americans took about one dollar in eight. Today the top rate is 37 percent and that same one percent takes more than one dollar in five.
Two things fell together, and a third rose to meet them. That is not a labor story. It is a description of a different political settlement.
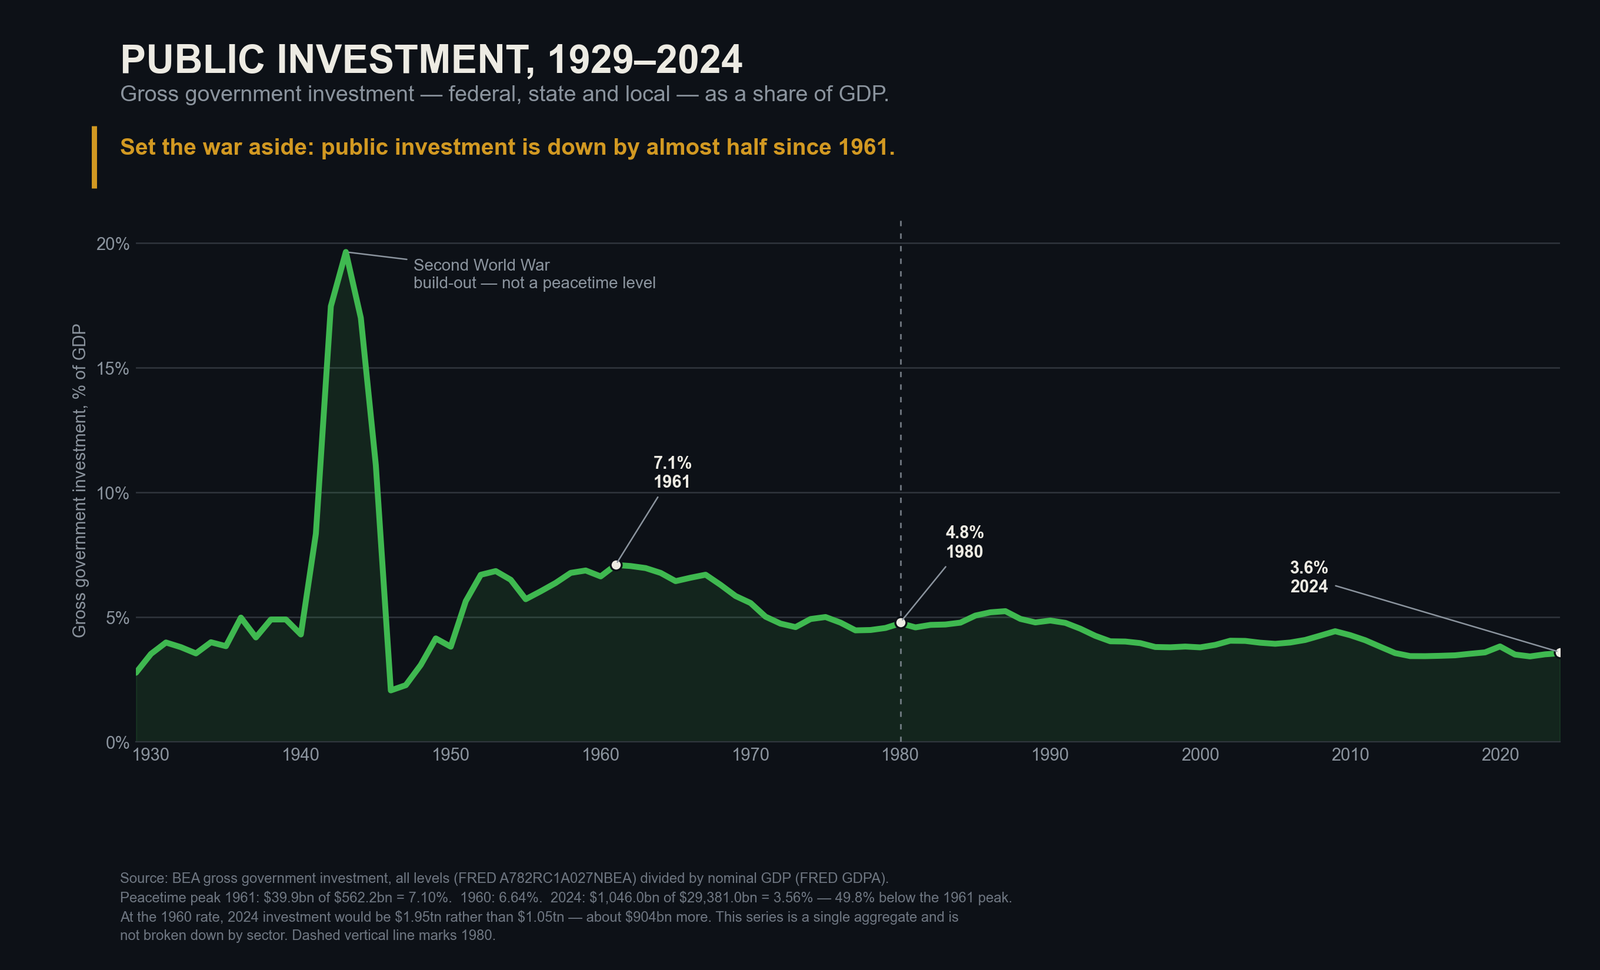
The third thing the coalition won is the one that is hardest to see and easiest to cut: public investment (Figure 2). Gross government investment — all levels, federal, state and local — reached its peacetime peak of 7.1 percent of GDP in 1961. Today it is 3.6 percent — almost exactly half.
Source: BEA gross government investment, all levels (FRED A782RC1A027NBEA) divided by nominal GDP (FRED GDPA). Single aggregate; not broken down by sector.
Put in today’s money, the gap is the whole argument. In 2024 the United States invested $1.05 trillion this way. Had it merely held the rate of 1960 — not the 1961 peak, simply the ordinary level of that era — it would have invested $1.95 trillion: nearly double, and about $900 billion more in a single year.
This is the spending that decides whether public services work and who can reach them — whether schools and universities are built, staffed with the facilities to teach in, and close enough to be a real option; whether clinics, transit and water systems are renewed or merely patched. When it falls for four decades, services do not vanish. They get older, slower and more unequal, and access narrows to the people who can afford the private alternative.
That capacity was not lost to a recession or a war. It was given up gradually, over the same decades and by the same politics that cut the top tax rate and let union membership fall.
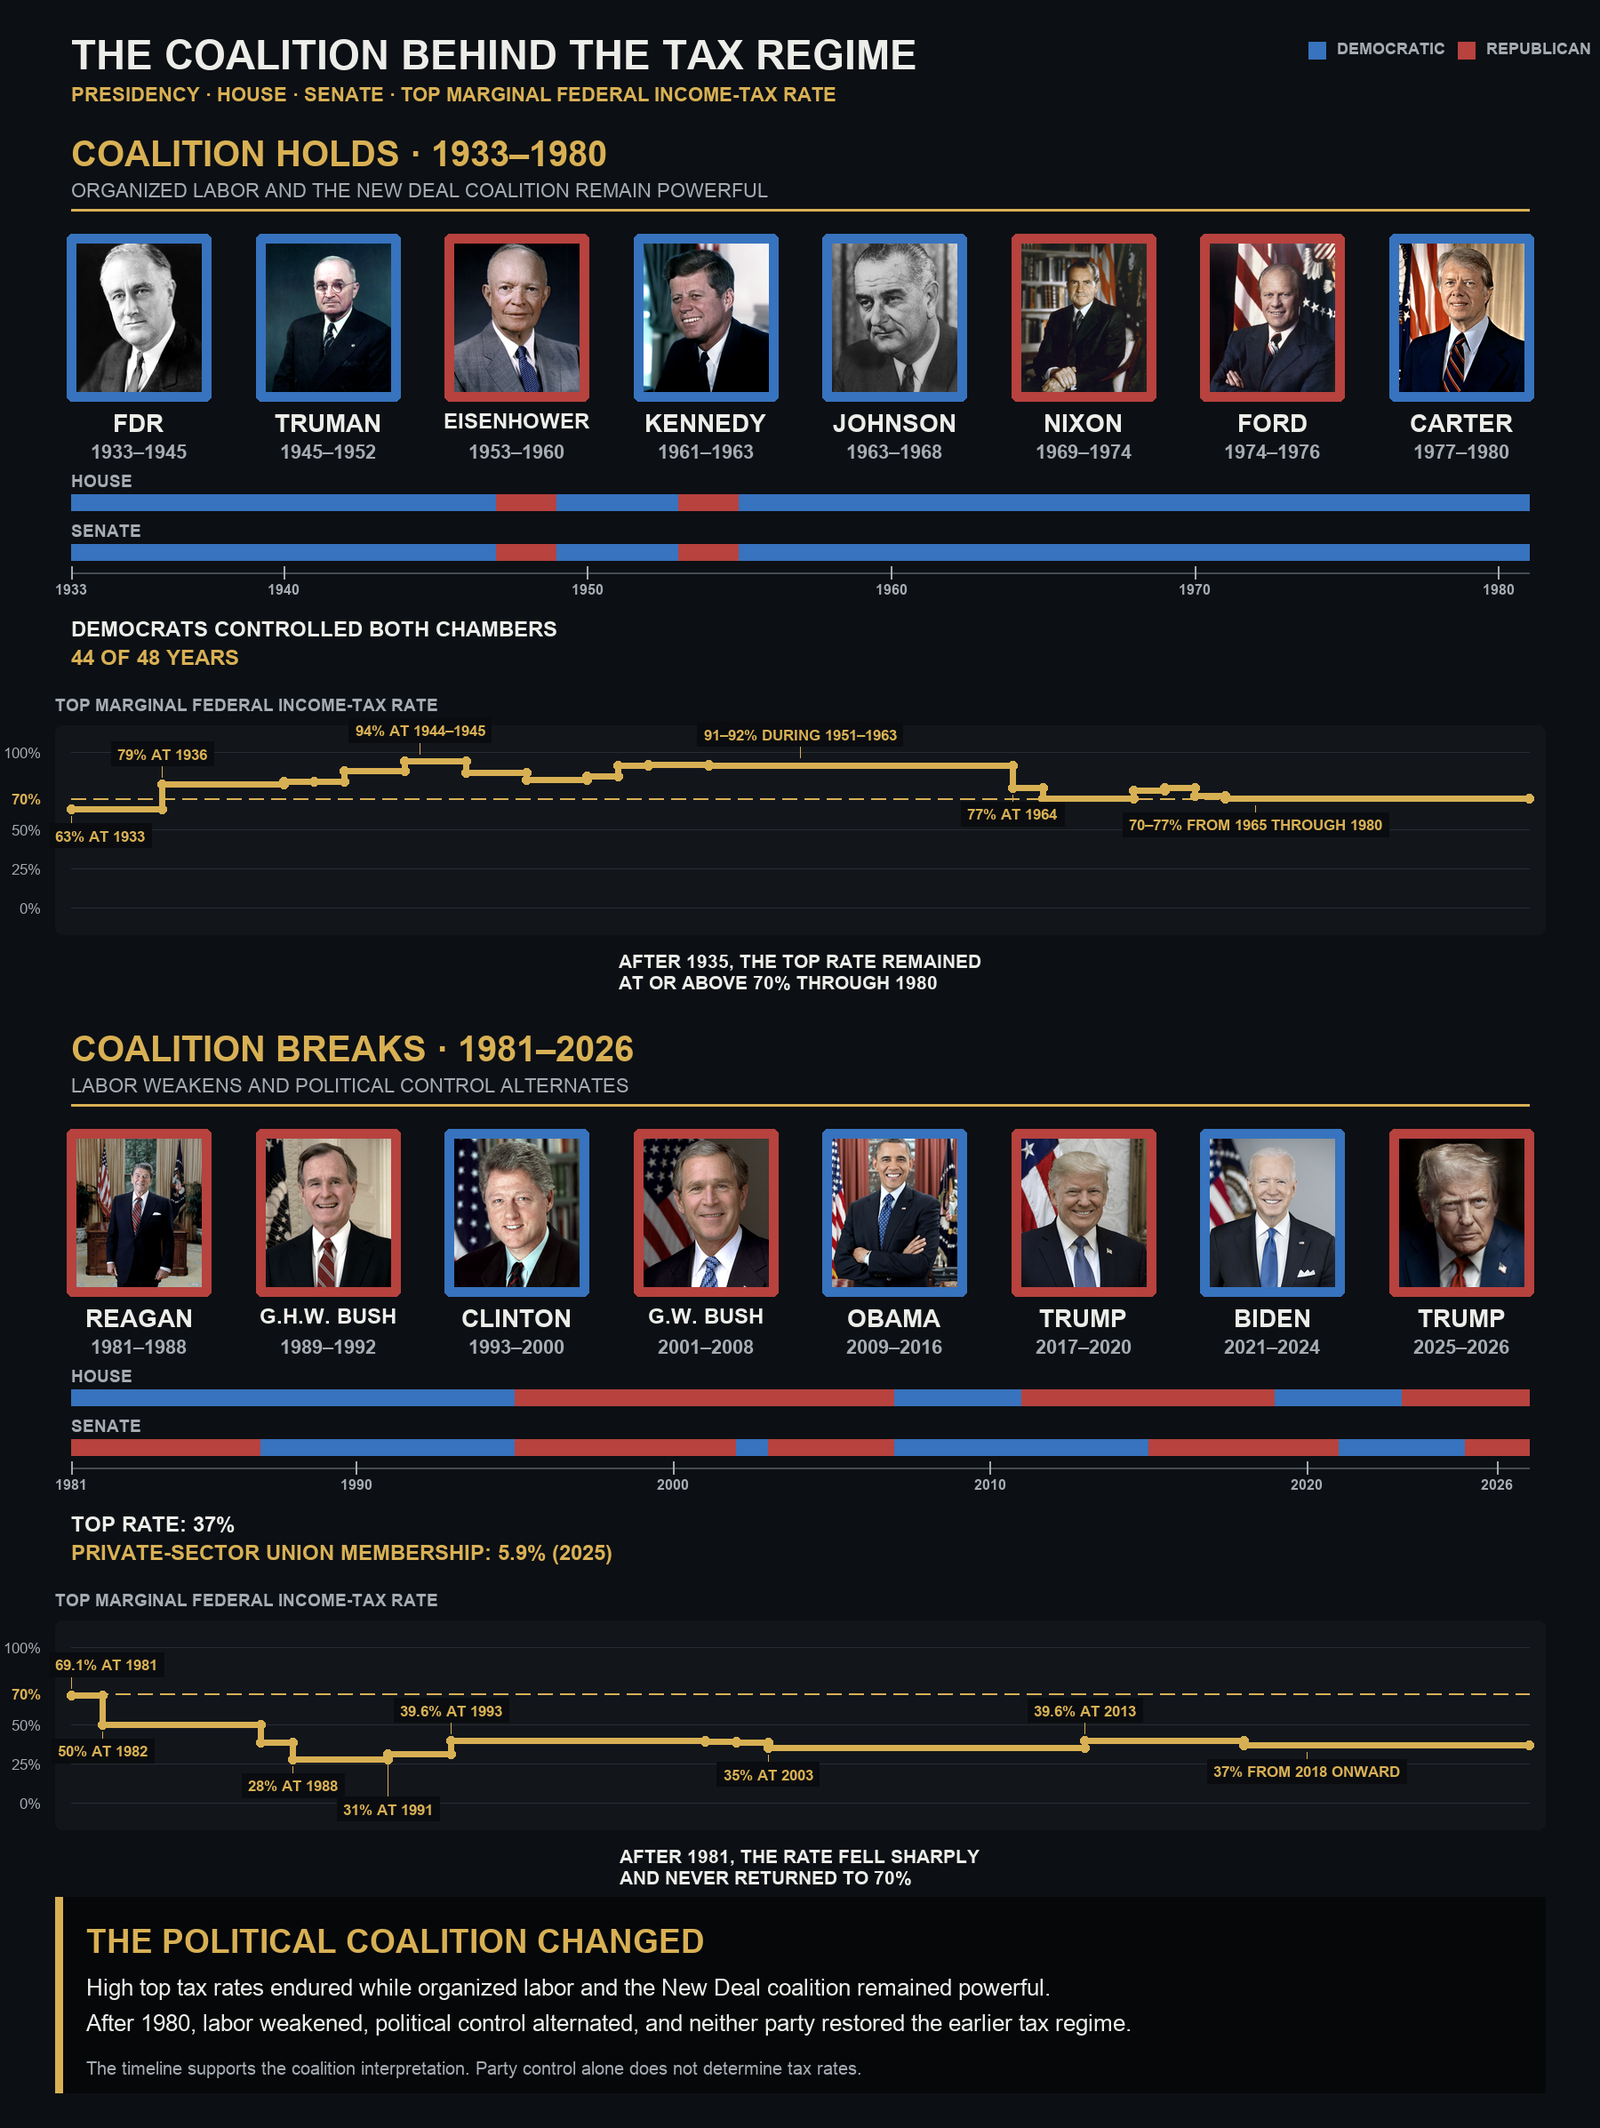
The Democratic Party became durable because its connection to workers was institutional, not merely rhetorical (Figure 3).
Source: U.S. House History, Art & Archives; U.S. Senate, “Party Division”; IRS SOI Historical Table 23; IRS tax-year 2026 inflation-adjustment notice; BLS, Union Members — 2025. Presidential portraits are U.S. federal or Library of Congress public-domain images.
And what took it apart
The figures should not be read as evidence that one president alone created or destroyed organized labor. Economic restructuring, racial conflict, technological change, employer opposition, deindustrialization, globalization, and regional political realignment all contributed to the historical pattern.
Nevertheless, presidential leadership and public policy mattered.
Roosevelt’s administration protected organizing at a decisive moment. Harry Truman vetoed the Taft–Hartley Act in 1947, although a Republican-controlled Congress overrode his veto. Taft–Hartley restricted union activity and allowed states to enact so-called right-to-work laws, helping establish the legal environment in which organized labor would later weaken.
Union density remained high during the postwar decades, but its decline had already begun before Ronald Reagan entered office.
Reagan’s dismissal of striking air-traffic controllers in 1981 was therefore not the beginning of the decline. It was an important political turning point. It demonstrated that even the federal government was willing to confront organized workers aggressively, and it encouraged a broader culture of employer resistance.
Later Democratic administrations did not fully reverse this direction. The Clinton administration embraced globalization and market-oriented economic policy while maintaining an uneasy relationship with organized labor. Barack Obama entered office with large congressional majorities, but comprehensive labor-law reform was not enacted. Joe Biden’s administration pursued more supportive labor policies and appointed a more worker-friendly National Labor Relations Board, but union density still did not experience a structural recovery.
Four decades, both parties, and the line kept falling.
This article stands on its own evidence. Readers who want the longer argument — how the same reversal shows up in tax rates, income concentration and corporate payouts across a full century — can find it in Episode 1 of the Wealth Drain series.
A party cannot represent workers only during elections
Democratic politicians frequently turn to organized labor during campaigns. They ask unions for endorsements, campaign contributions, volunteers, and votes. But a genuine political coalition cannot operate in only one direction.
If labor is expected to help elect Democratic politicians, those politicians must use public power to help workers organize, bargain, and obtain a fair share of the wealth they produce.
That means more than attending a picket line or describing oneself as pro-union. It requires concrete commitments. These are proposals rather than findings — arguments about what would work, not measurements of what happened — each targeting a mechanism visible in the figures above:
- Protecting workers who attempt to organize.
- Imposing meaningful penalties on employers that violate labor law.
- Preventing companies from delaying first contracts indefinitely.
- Defending the right to strike.
- Expanding collective bargaining into sectors where workplace-by-workplace organizing is exceptionally difficult (Figure 1).
- Connecting public investment and government contracts to strong wages, apprenticeships, and organizing rights (Figure 3).
- Protecting workers from misclassification, wage theft, and retaliation.
- Ensuring that trade and industrial policies strengthen communities instead of treating workers as disposable costs.
The choice the party cannot avoid
These commitments are not politically neutral. They transfer bargaining power from employers to workers, and that means they will be opposed by some of the interests that finance political campaigns.
Not every Democratic donor is hostile to labor. But when a donor’s profits depend on low wages, union avoidance, subcontracting, weak enforcement or the freedom to fire organizers, the conflict is real. The party cannot promise to strengthen workers while allowing those interests to veto the policies that would make workers stronger.
At that point, Democrats must choose.
Choosing labor does not mean refusing every contribution from a wealthy person or business. It means that a contribution buys no veto over workers’ rights. It means accepting that some donors will leave when the party supports enforceable organizing rights, meaningful penalties, timely first contracts, sectoral bargaining and labor standards attached to public money.
The practical test is not whether Democratic politicians describe themselves as pro-labor. It is whether they will spend political capital — and risk financial support — when worker power conflicts with donor profit.
If labor is expected to provide votes, volunteers, money and organization, politicians must deliver more than access and sympathetic language. They must help create the legal conditions under which workers can build power of their own.
Otherwise, this is not a coalition. It is a transaction in which workers are always asked to pay first.
The new Democratic Congress will face an immediate limitation: President Trump remains in office and can block legislation. But that does not make the victory meaningless.
Congress can investigate attacks on workers’ rights, expose corruption, resist further anti-labor measures, defend federal institutions, propose a clear working-class program, and force every politician to take a public position. Democratic governors and state legislatures can also act where federal legislation is blocked.
Most importantly, Democrats can demonstrate what they intend to do if voters give them full governing power in 2028.
What this victory is, and how it becomes power
Almost none of what is listed above can be signed into federal law before 2029, so measured by bills passed these two years will look thin. That is the wrong measure, and taking it is how the last several victories were wasted. The value of this result is not what it passes. It is what it builds.
Two conversions are available immediately. Force public positions. Bills that will be vetoed still make every politician say, on the record, whether workers should be able to organize. That record is what a 2028 mandate is built from. Use the states. Where Democrats hold governorships and legislatures, some of this does not need Washington. Sectoral standards are the clearest route, and several states already set wages and conditions sector by sector. Federal labor law preempts a good deal of state regulation of private-sector organizing, so the boundary has to be drawn carefully — but public employees, state contractors and sector-wide standard-setting sit largely outside that limit, and that is where most workers who can be reached without Congress actually work.
The third conversion is the one that decides the rest. The coalition that kept both chambers Democratic for 44 of the 48 years from 1933 through 1980 was not held together by legislation; it was held together by membership. Millions of people belonged to organizations that represented them between elections, and that is why the arrangement survived losing some of those elections. A party that spends these two years helping workers organize — and not only asking them to vote — will still have something in 2032. A party that spends them fundraising will be back here, celebrating another temporary victory.
Which means the honest test of this win arrives long before the next one. In 2028, the question is not whether Democrats held these seats. It is whether union membership is higher than the ten percent they inherited.
Labor must retain independent power
The responsibility does not belong only to politicians. Organized labor must also avoid becoming merely an electoral arm of the Democratic Party.
A union’s first responsibility is to its members and to working people. Labor must be capable of supporting politicians who deliver, pressuring those who hesitate, and opposing those who abandon workers — regardless of party.
The choice after victory
The 2026 Democratic victory creates an opportunity, but it does not guarantee a political realignment. There are two paths out of a night like this one, and only one of them has ever held.
Democrats can treat the result as another temporary swing in the electoral cycle. They can concentrate on investigations, fundraising, campaign strategy, and the next presidential candidate while leaving the economic organization of working people unchanged.
Or they can recognize the deeper historical lesson.
We already know what the first path produces, because it is what the last forty years produced: narrow majorities that arrive and leave, and a policy line that never turns. Anger without organization is weather, not force — and so is an election night.
The second path is the one that actually won — for both sides. While the coalition held, workers got Social Security, collective bargaining, the forty-hour week and a tax regime that paid for what the country built. The party got 44 of 48 years with both chambers of Congress (Figure 3). Neither of those was charity from the other. Labor delivered organized power, and politicians delivered for workers, and each made the other stronger. Since the coalition broke, neither side has had much of either: union density is less than a third of what it was, and no majority has lasted long enough to turn the line on any of these three figures.
That choice carries a financial cost. Some donors will leave when worker power threatens their business interests. But a party unwilling to risk donor money in order to build worker power is not rebuilding a coalition. It is renting workers at election time.
That is the test. Not what they say about workers. Whether they are willing to rebuild the thing that made them win.
The Democratic Party was strongest when millions of workers belonged to institutions that organized them, educated them, represented them, and connected economic demands to political action. As those institutions weakened, the party’s relationship with working people became increasingly dependent on advertising, personality, and temporary opposition to Republican governments.
That is not a durable foundation for democratic power.
The goal should not be to reproduce every feature of the old New Deal coalition. That coalition contained serious exclusions and contradictions, particularly concerning race, gender, immigration, and the workers left outside labor protections. A new coalition must be broader, more democratic, and suited to an economy dominated by services, logistics, technology, care work, franchises, contractors, and digital platforms.
But its governing principle remains relevant: political democracy becomes stronger when ordinary people possess organized economic power.
The midterm victory is worth celebrating. But celebration must be followed by organization, legislation, and accountability.
If Democrats want this victory to become more than a temporary reaction against Donald Trump, they must help rebuild the institutions that give working people a permanent voice. And if organized labor wants political influence, it must demand more than sympathetic speeches from politicians.
The future of both depends on rebuilding a coalition in which labor delivers organized power and politicians deliver for workers.
Data and sources
- Union membership rate. CRS Table A1 and BLS historical series, 1930–1981; Hirsch, Macpherson & Even, Unionstats CPS database, 1983–2025. No 1982 observation. The series changes basis in 1982: nonagricultural employment before, CPS wage-and-salary workers after. 2025 is an 11-month CPS average.
- Top marginal individual income-tax rate. Tax Policy Center, “Historical Highest Marginal Income Tax Rates”, 1930–2017; 37 percent for 2018–2024.
- Top 1% income share. Share of pretax family income including realized capital gains.
- Public investment. Gross government investment, all levels (BEA series A782RC1A027NBEA) divided by nominal GDP (BEA GDPA). 1960: $36.0bn of $542.4bn = 6.64 percent. 2024: $1,046.0bn of $29,381.0bn = 3.56 percent. The $900bn figure is the 3.08-point gap applied to 2024 GDP. This series is a single aggregate and is not broken down by sector.
- Election result. Network projections as of 4 November 2026; results are not certified.
Episode Media and Research Figures
Topics: union membership · labor · Democrats · midterms · tax policy · public investment