 By admin
 The Dam Series — Chapter 1 of 11
The Introduction revealed that the U.S. economy has a structural drain — a pipe opening wider since 1980, pulling wealth upward while wages stagnate and debt accumulates. But is this new? Did it happen before? Is there a pattern?
This chapter answers those questions by going back 150 years. It traces a six-stage cycle — extraction, crisis, protest, reform, inclusion, reversal — that has repeated three times in American history. Each time, the cycle ends the same way: a coalition forms, wins real reform, then breaks apart — and the extraction begins again. By the end, you will recognize exactly which stage we are living through today.
The Dam Series — Chapter 1: Wealth Inequality in America — The Elite Cycle
Key Takeaways
- American history follows a repeating six-stage cycle: Extraction → Crisis → Protest → Reform → Inclusion → Reversal.
- The cycle has run three complete times. Each time it ends the same way: the progressive-labor coalition breaks, and the elites regroup.
- Cycle 1: Gilded Age extraction → labor massacres → TR/Wilson reforms → coalition breaks → 1920s speculation.
- Cycle 2: 1920s crash → Great Depression → FDR New Deal → Golden Era → Reagan reversal.
- Cycle 3: 1980 to today — three crashes (S&L, Dot-Com, 2008), but no reform. The coalition never came back.
- The top 1% today controls 21.8% of national income — almost exactly the pre-Great Depression level of 1929.
She was thirteen years old, and her name was Mary Harris. It was 1875, and she lived in a company town in Pennsylvania — a place called Homestead, where the steel mills owned everything: the houses, the stores, the hospital, the schools.
Her father worked in the mills. Twelve hours a day, six days a week. No overtime. No sick leave. No retirement. When he broke his arm, the company said it was his fault. He got nothing. Her mother took in sewing to keep the family alive.
Mary Harris would become one of the most famous labor organizers in American history.
But that day, in 1875, she was just a child watching her father’s hand heal crooked, watching her mother’s fingers bleed from sewing needles.
She was watching the extraction.
And she was not the first. She would not be the last.
The Pattern
There is a pattern in American history. It repeats. It has a structure.
Stage 1: Extraction. Wealth concentrates at the top. A structural drain opens. The wealthy accumulate, the middle class stagnates, the poor deteriorate.
Stage 2: Crisis. The system destabilizes. A crash, a depression, a collapse. The borrowed water runs out.
Stage 3: Protest. Working people reach a breaking point. Labor action, political movements, mass pressure.
Stage 4: Reform. Political leaders implement structural repairs. Tax rates rise. Union rights protected. Public investment accelerates.
Stage 5: Inclusion. A generation of shared prosperity. The middle class grows. Wages rise. Debt falls.
Stage 6: Reversal. Memory fades. The elite gradually recapture political power. Reforms are quietly undone. The extraction resumes.
And then — crucially — the cycle begins again. Because of what happens in the reversal: the progressive-labor coalition breaks. When that coalition fractures, when progressive leaders stop standing with workers and start serving donors, the door opens. Every single time. Figure 1.1 maps the full six-stage structure and the three historical repetitions.
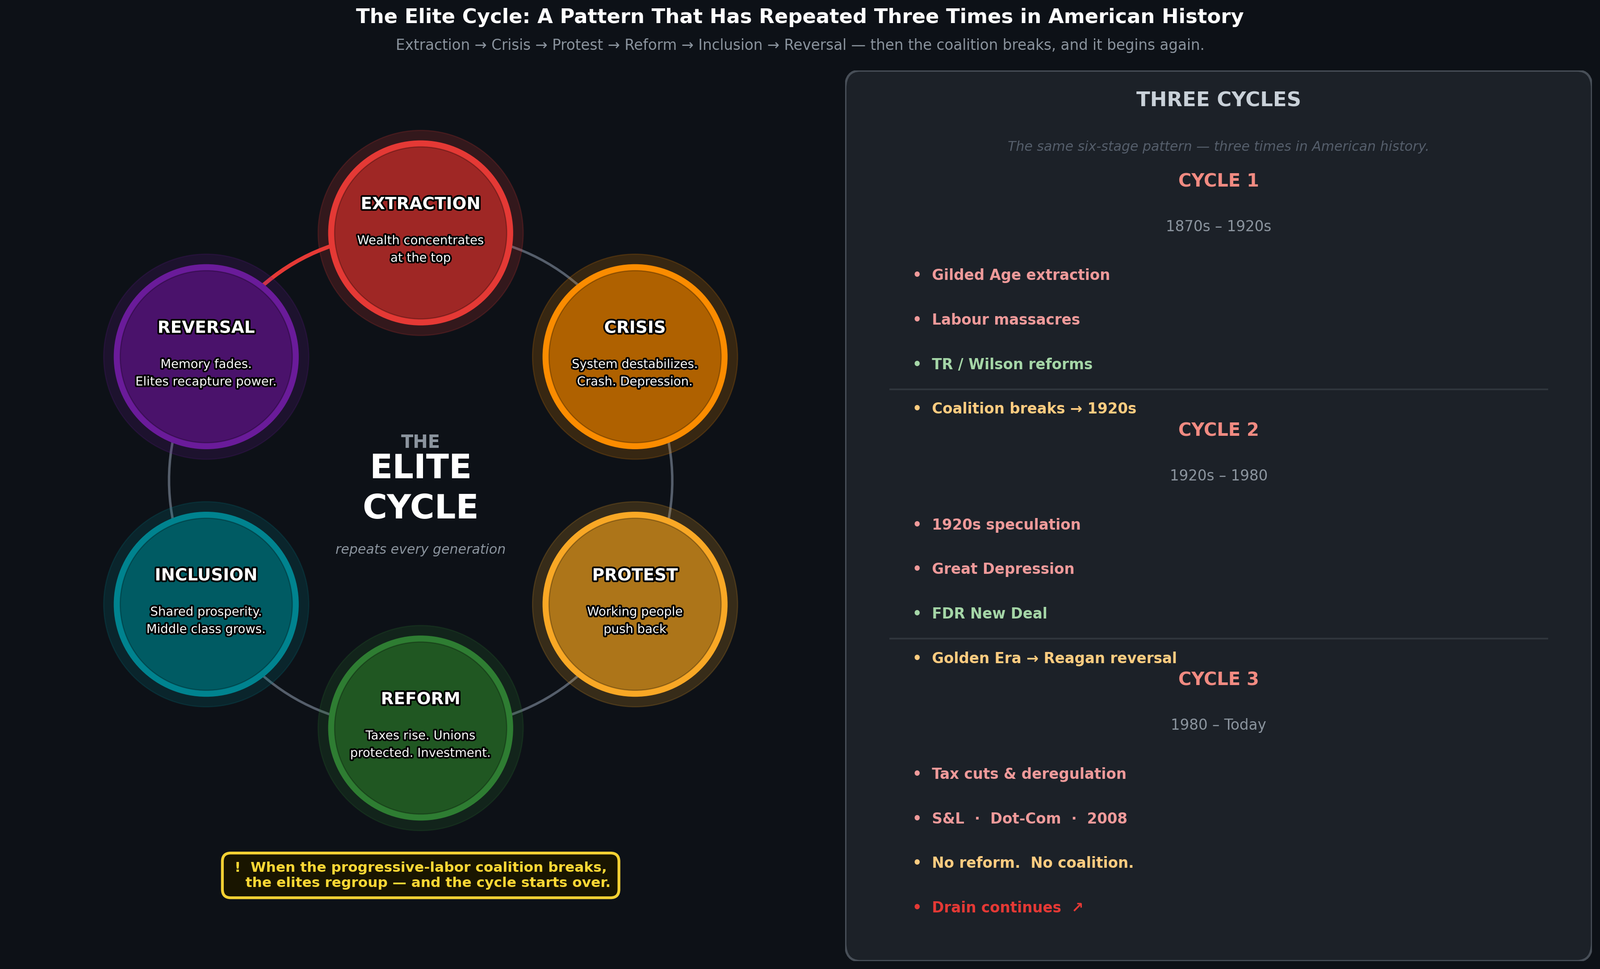
How to read Figure 1.1: Follow the arrows clockwise from Extraction at the top. Each phase leads to the next. The red arc at the top — from Reversal back to Extraction — is the hinge point of the whole cycle. That red arrow is where the progressive-labor coalition breaks, progressives choose donors over workers, and the elites walk back through the open door. The right panel shows where each of the three historical cycles falls on this structure.
The dam translation: The dam has a rhythm: it drains, it breaks, it gets repaired, it fills, then it drains again. The question is not whether it drains. It always drains. The question is how long the repairs hold — and what breaks them.
Cycle 1: The Gilded Age → The Progressive Era (1870s–1920s)
John D. Rockefeller controlled 91% of American oil refining by the 1890s. Standard Oil was not a company. It was an extraction mechanism. (Source: U.S. Supreme Court, Standard Oil v. United States, 1911)
Andrew Carnegie owned one-quarter of all American steel. J.P. Morgan controlled railroads and banking. Cornelius Vanderbilt owned shipping and rail networks.
Workers in this era endured conditions that are difficult to imagine today. Twelve to sixteen hour days — not occasional, but daily. Seven days a week. Children as young as six worked in mills. (Source: U.S. Bureau of Labor Statistics, Historical Labor Data) No retirement. No healthcare. An injury meant the end of income and immediate poverty.
By 1929, the top 1% of Americans captured 22.5% of all national income. (Source: Piketty & Saez, NBER Working Paper 8467)
And when workers protested, the state responded with bullets.
The Four Labor Massacres
The Great Railroad Strike of 1877 shut down rail systems across the country. Workers demanded an 8-hour day. Federal troops were deployed. Scores were killed. Workers got nothing.
In 1892, at Homestead Steel — Mary Harris’s town — workers struck against a wage cut. Pinkertons attacked strikers with guns and dynamite. Twelve died. Wages were cut anyway.
In 1894, President Cleveland sent federal troops to break the Pullman Strike. Workers demanding an end to wage cuts. Federal troops killed dozens. Strike broken.
In 1914, at the Ludlow Massacre, state militia attacked a tent city of striking coal miners. Machine guns. Thirteen children and two women killed in a tent fire.
This was the system’s response to protest: violence. The drain had to be maintained.
The Reform That Didn’t Hold
Then came the first serious reform attempt.
Theodore Roosevelt — a Republican — took on the robber barons directly. He broke up Standard Oil. He regulated railroads. He protected public lands. His successor, Woodrow Wilson — a Democrat — pushed further: the Federal Reserve (1913), the Federal Trade Commission (1914), the first permanent income tax.
For the first time, the wealthy were taxed. For the first time, monopolies were constrained.
A fragile coalition had formed: progressive reformers and organized labor, working together.
And it worked — briefly.
But the coalition didn’t hold. When the crisis faded and memory softened, progressives drifted away from labor. The coalition cracked.
The elites returned.
Under Republican presidents Harding, Coolidge, and Hoover in the 1920s, the reforms were dismantled one by one. Tax cuts for the wealthy. Deregulation. Union suppression.
The extraction resumed.
The dam translation: The leak was sealed for a moment — but not long enough, and not completely enough. When the coalition broke, the elites found the crack and pried it open again.
Cycle 2: The New Deal → The Golden Era (1920s–1980)
By 1928, the Gilded Age had returned in a new form.
Stock prices soared not because companies were more productive, but because speculation had become a form of wealth itself. Working people bought stocks on margin — 10% down, 90% borrowed. The system expanded beyond any reasonable limit.
October 1929: the market crashed. Nine thousand banks failed between 1930 and 1933. Savings vanished. Unemployment reached 25%. Breadlines stretched around city blocks. Homeless camps — called Hoovervilles — appeared in every major city.
The dam cracked.
The New Deal Coalition
Franklin D. Roosevelt was not a socialist. He was a wealthy man trying to save capitalism. But he understood something today’s leaders seem to have forgotten: if the system drains too much, it will break. And if it breaks entirely, the alternatives are worse.
He acted.
The top tax rate was raised from 25% to 79% in 1936, then to 94% by 1944. (Source: Tax Policy Center, Historical Highest Marginal Income Tax Rates)
The Wagner Act (1935) legalized unions and protected workers’ right to organize. Union membership exploded from 10% to 35% of the workforce. (Source: Bureau of Labor Statistics) Workers gained real power.
Social Security created (1935). Glass-Steagall banking regulations (1933). Securities regulation. The regulatory architecture was rebuilt — stronger than before.
This time, the coalition held long enough.
The Golden Era
From 1945 to 1980, the top tax rate never fell below 70%. It was 94% during the Korean War, 91% through the 1950s and 1960s.
And in that same period, the middle class exploded into existence.
Median family income, adjusted for inflation, doubled between 1947 and 1973 — a single income could support a family, a summer job could pay college tuition. (Source: U.S. Census Bureau)
Signal: Homeownership: 65% | Poverty rate: 35% (1950) → 11.1% (1973) | Top 1% income share: 11.8% at lowest point (1976) (Sources: Census Bureau Historical Poverty Tables; Piketty & Saez, NBER)
The wealthy still became wealthy. But they could not drain the system to the point of collapse.
The dam was full. The water was circulating. This was the only period in American history when the system worked for more than a tiny fraction of people.
The Coalition Breaks Again
Then, slowly and systematically, it came apart.
In 1980, Ronald Reagan was elected. The top tax rate was cut from 70% to 50% in his first year, then to 28% by 1988. (Source: Tax Policy Center) The labor movement was explicitly attacked. In 1981, Reagan fired every striking air traffic controller and banned them from federal employment for life. The message: unions are the enemy.
Financial regulation was dismantled. Glass-Steagall — which had protected the banking system since 1933 — was weakened and finally repealed under Clinton in 1999.
Notice that last line: Clinton. A Democrat. A progressive leader who chose the financial elites over the working coalition. He opened the door.
Because here is the hard truth of this cycle: when progressive leaders choose donors over workers, the coalition breaks. And when the coalition breaks, the elites walk through the door.
The dam translation: For thirty-five years, the dam held because the coalition kept it sealed. When the coalition broke, the drain opened again — not just under Reagan, but under Clinton, under both parties, across decades.
Cycle 3: Reagan to Today — The Broken Cycle (1980–Present)
This is where we are now. And this cycle is different from the previous two.
It is different because this time, the collapses came — and no reform followed.
Three Crashes. No Reform.
The Savings & Loan Crisis (1989–1991). The first crack. Deregulation allowed savings banks to speculate wildly. Over a thousand institutions failed. The taxpayer bailout: $132 billion. Executives walked away rich. Workers lost savings. No structural reform.
The Dot-Com Crash (2000–2002). A speculation bubble built on blind faith in markets and enabled by deregulated financial flows. The Nasdaq lost 77% of its value. Trillions in wealth evaporated. No structural reform.
The 2008 Financial Meltdown. Fueled by financial deregulation, mortgage speculation, and exotic instruments that no one fully understood. The government bailed out the banks — $700 billion. Millions of people lost their homes and savings. Unemployment hit 10%. And the response? The banks were saved. The homeowners were left to fend for themselves. No structural reform.
Three crashes. Each one a signal that the system was draining past the point of stability. Each one followed by a bailout for those at the top. None followed by the structural repairs that had come after 1929.
Why No Reform This Time
Because the coalition never came back.
Progressive leaders — the people who should have led the reform — had by then built their donor bases in the financial sector. They served Wall Street. They left the door open.
Without the coalition, there was no political force large enough to demand structural repair. Without structural repair, the drain continued. Unchallenged. Uninterrupted.
And then COVID hit.
It exposed everything. The public systems meant to protect citizens — hospitals, schools, safety nets — had been systematically dismantled by decades of extraction. The pandemic revealed the skeleton of a system that had been quietly hollowed out.
Nothing was fixed. The drain kept running.
The dam translation: Three times the dam cracked in this cycle. Three times the owners were bailed out. Three times the leak was not sealed — because the coalition that used to seal it had broken apart. The drain has run, unchallenged, for over forty years.
The Most Important Number
Here is the number that contains the entire argument:
The top 1% income share in 2024 stands at 21.8% — almost exactly where it was in 1929, the moment right before the system crashed.
Signal: 1929 (Great Depression eve): 22.5% → 1976 (Golden Era peak): 11.8% → 2024: 21.8%. The cycle has completed.
We are back. We have completed the cycle. We are living at the same level of inequality as 1929 — the moment right before the system crashed.
History does not repeat, the saying goes. But it rhymes.
And the rhyme is getting louder. The chart below (Figure 1.2) tracks four structural indicators from 1929 to today. All four tell the same story. All four flip in the same year.
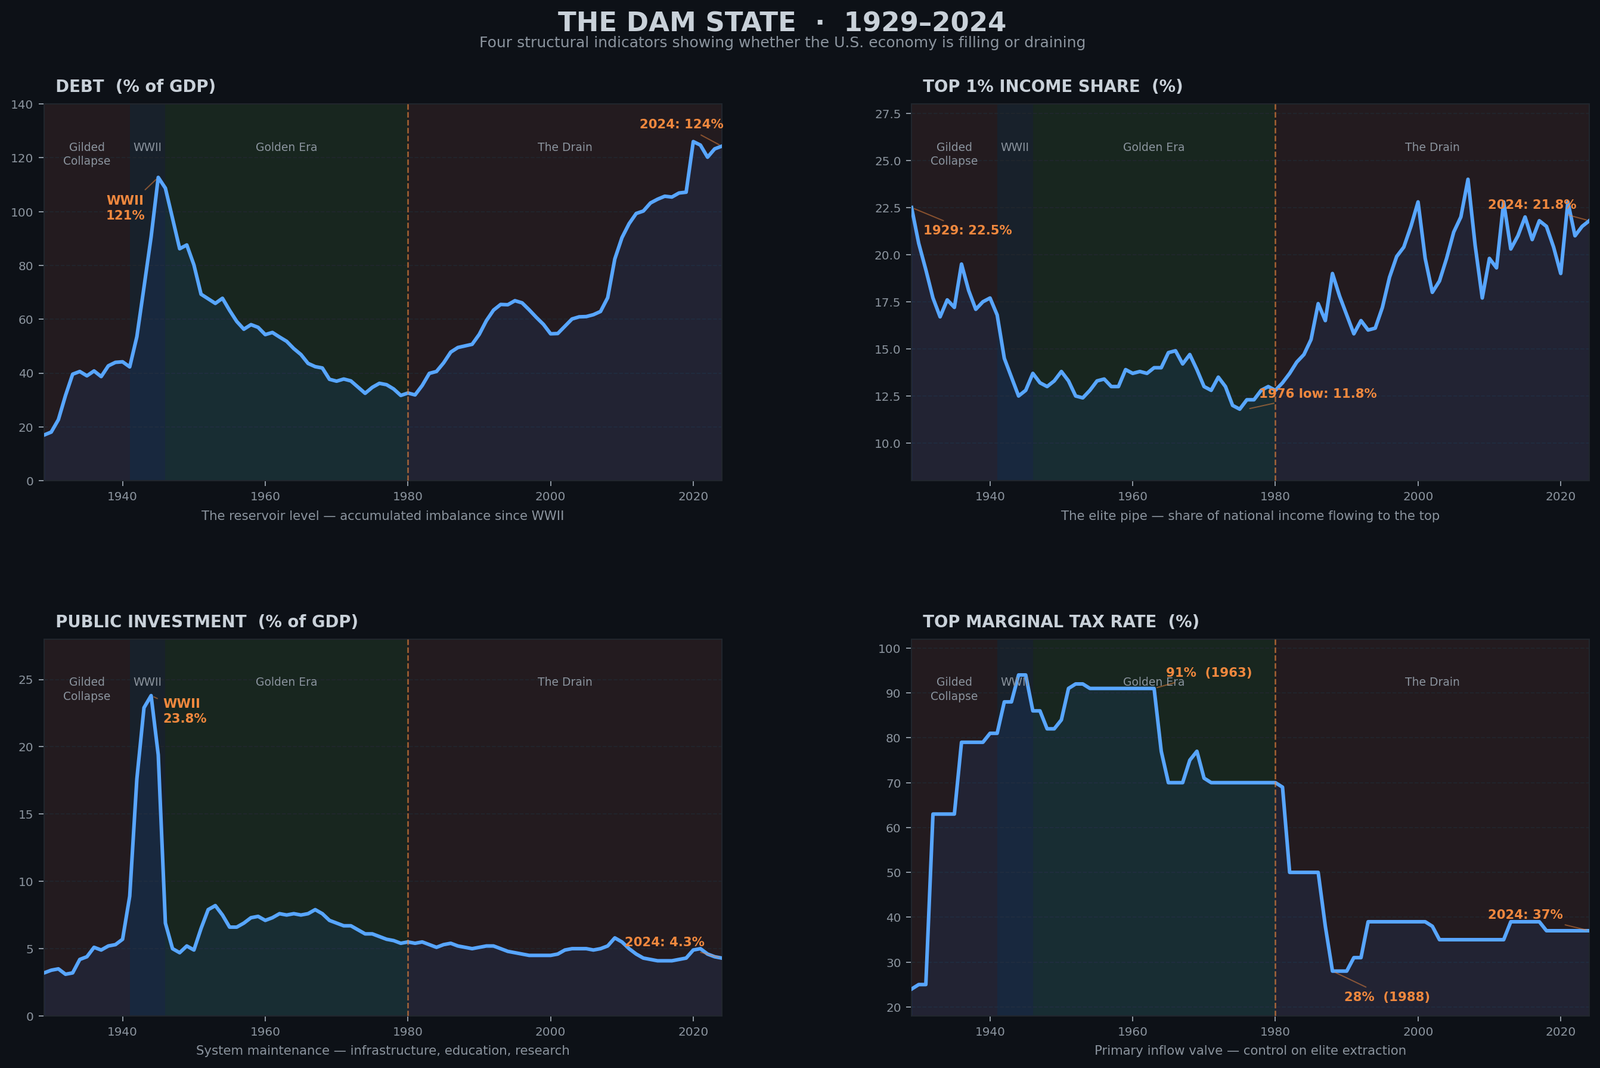
How to read Figure 1.2: Four panels, same timeline. Top left: Government debt — peaked with WWII at 113%, fell for 34 years, reversed in 1980, now at 124%. Top right: Top 1% income share — fell from 22.5% in 1929 to 11.8% in 1976, back to 21.8% today. Bottom left: Public investment — rose through the Golden Era, declining to 4.3% today. Bottom right: Top marginal tax rate — held above 86% from 1941 to 1963, cut to 37%. Every single panel inflects in 1980. One mechanism, visible in four mirrors simultaneously.
The dam translation: The water level is where it was in 1929 — before the catastrophic drain. The dam is at the same structural stress point it was at before the Great Depression. The cycle is completing.
Where Are We Now?
This is not just history. This is the structure we are living in.
The signs of Stage 3 — Protest — are everywhere. Union organizing is accelerating among young workers. The strikes of 2023 — Hollywood writers, actors, autoworkers — were the largest coordinated labor actions in a generation. (Source: Bureau of Labor Statistics, Work Stoppages)
Political movements on both the left and right are challenging the system. The establishment is losing its ability to define the debate.
But history also shows the danger.
When Stage 3 protest is large enough, it forces Stage 4 reform. When it is not large enough — or when it is absorbed, co-opted, or crushed — the system doesn’t reform. It collapses further. And economic collapse, when people are desperate enough, historically opens the door to authoritarianism.
The cycle does not determine the outcome. We do.
But you cannot choose a path without understanding the territory. That is what this chapter has given you: the map. Three cycles. The same mechanism each time. The same breaking point each time.
The outcome depends on whether the coalition forms again — and whether, this time, it holds.
The dam translation: When the water level falls too far, the people downstream start to organize. They demand the leak be sealed. That moment is arriving now. What happens next depends on whether the coalition holds this time — or breaks again and lets the cycle run a fourth time.
What Comes Next
You now know the pattern. You have felt the historical weight of it.
But knowing the pattern is not the same as understanding the mechanism.
How does wealth extraction actually work? What is the physical structure of the drain? Which pipes were opened, when, by whom, and by how much?
The next chapter — How the U.S. Economy Really Works — shows you the blueprint of the dam itself. Piece by piece. Mechanism by mechanism. With the names attached.
Because that is where real power lies: not in anger about the extraction, but in understanding the mechanism. Once you understand the mechanism, you can imagine repairing it.
The Dam Series: The Hidden Drain Destroying the American Middle Class — All Chapters
Read the full series at rational-observer.com. New chapters publish weekly.
| Title | What it covers | Status | |
|---|---|---|---|
| Intro | Why The American Economy Feels Broken | The dam metaphor. The 1980 turning point. Why this is not partisan. | ✅ Published |
| Ch. 1 | You are here — Wealth Inequality in America: The Elite Cycle | The six-stage extraction cycle that has repeated three times in U.S. history — and which stage we are in now. | ✅ Published |
| Ch. 2 | How the U.S. Economy Really Works: The Dam Explained | The four components of the dam: inflow, outflow, the elite pipe, and debt. The WWII proof that debt is a symptom, not the disease. | ✅ Published |
| Ch. 3 | Why Americans Can’t Afford to Live Anymore | The scissors chart: wages +31%, costs of housing + healthcare + education +413% since 1970. The invisible depression. | 🔜 Coming Soon |
| Ch. 4 | Obama’s Economy: The Surface Patch | How 2008 was stabilized without structural repair — and how Trump then widened the drain deliberately. | 🔜 Coming Soon |
| Ch. 5 | The Illusion of Refill: Why Tariffs Cannot Fix the Dam | What tariffs actually are, what happened in April 2025, and why the bond market reversed policy in under 90 days. | 🔜 Coming Soon |
| Ch. 6 | Does Trickle-Down Economics Work? 45 Years of Data | Buybacks grew 157-fold. Wages grew 35%. The complete evidence on supply-side economics — who it worked for and who it didn’t. | 🔜 Coming Soon |
| Ch. 7 | Why Nations Fail: The U.S. Transition From Inclusive to Extractive | The 2024 Nobel Prize-winning framework applied to the United States — and what it reveals about the structural transition since 1980. | 🔜 Coming Soon |
| Ch. 8 | 2025 and 1929: When History Repeats Exactly | Tariffs, tax cuts at the top, and federal capacity cuts — the identical toolkit deployed in 1929 that caused the Great Depression. | 🔜 Coming Soon |
| Ch. 9 | Why the U.S. Dollar Is Losing Power | De-dollarization, Bretton Woods, the petrodollar, and what the April 2025 bond market crisis revealed about external inflow. | 🔜 Coming Soon |
| Ch. 10 | Trust, Once Spilled | The Marshall Plan, 80 years of institution-building, and what is being dismantled — faster than it can be rebuilt. | 🔜 Coming Soon |
| Ch. 11 | The Final Warning | A climate scientist’s verdict on a system approaching a tipping point — and the historical evidence that repair is still possible. | 🔜 Coming Soon |
Sources & Further Reading
Historical Income and Wealth Inequality Data:
Piketty & Saez, NBER Working Paper 8467 (2001) — “Income Inequality in the United States, 1913-1998” — Foundational dataset on top income shares. Underpins the 1929 and 1976 figures cited here.
https://www.nber.org/papers/w8467
World Inequality Database (WID) — Updated top 1% income share estimates for the United States across the full century.
https://wid.world/
Tax Policy and Historical Tax Rates:
Tax Policy Center, Brookings Institution — “Historical Highest Marginal Income Tax Rates” — Documents the 70%→50%→28% Reagan cuts and the 91-94% rates during the Golden Era.
https://taxpolicycenter.org/statistics/historical-highest-marginal-income-tax-rates
Labor Market and Union Data:
U.S. Bureau of Labor Statistics, Union Membership Data — Tracks union membership from 10% (1930s) through 35% (1950s) to current levels, documenting the post-1980 decline.
https://www.bls.gov/news.release/union2.htm
U.S. Bureau of Labor Statistics — “Work Stoppages (Strikes)” — Records the 2023 surge in major strikes, the highest since the early 2000s.
https://www.bls.gov/wsp/
Income and Poverty Statistics:
U.S. Census Bureau — “Historical Income Tables: Families” — Median family income data showing the doubling of real income between 1947-1973 and subsequent stagnation.
https://www.census.gov/data/tables/time-series/demo/income-poverty/historical-income-families.html
U.S. Census Bureau — “Historical Poverty Tables” — Poverty rate decline from 35% (1950) to 11.1% (1973).
https://www.census.gov/data/tables/time-series/demo/income-poverty/historical-poverty-people.html
Federal Debt and Deficit Data:
Office of Management and Budget (OMB) — “Historical Tables” (Table 7.1) — Federal debt records: peak of 113% of GDP in 1945, decline to 26% by 1980, climb to 124% by 2024.
https://www.whitehouse.gov/omb/information-resources-budget/historical-tables/
The S&L Crisis:
FDIC — “History of the Eighties — Lessons for the Future” — Volume I covers the Savings and Loan crisis in full, including the $132 billion taxpayer cost.
https://www.fdic.gov/bank/historical/history/
The author behind Rational-Observer is a climate scientist and data analyst who studies flow systems — in water, atmosphere, and economics. He writes at rational-observer.com.

