
Chapter 1 showed the historical pattern: a five-phase cycle of extraction and reform that has repeated across 150 years of American history — and the stage we are in today. But patterns only explain the what. This chapter shows the how.
Here is the physical blueprint of the economic dam: four components — inflow, outflow, the elite pipe, and debt — that govern the entire system. Once you see this structure, every economic news headline, every political debate, every claim about the national debt will look different. You will know exactly which pipe they are talking about — and which ones they are ignoring.
Key Takeaways
- The U.S. economy is a flow system with predictable physics: inflows must balance outflows, or the system accumulates debt.
- Four components determine the state of the economy: Inflow (taxes, wages, productivity), Outflow (public goods and services), the Elite Pipe (structural mechanisms that drain wealth upward), and Debt (the gap filler).
- The Elite Pipe is not one leak. It has four functional branches and fourteen documented channels: money moved through finance, higher prices through market power, public money or public protection converted into private gain, and taxes that do not flow back. The channels are measured differently — some are annual national flows, some are documented program examples, some are global estimates, and some are policy mechanisms — so they must not be added into one false combined total.
- The top marginal tax rate is the primary control valve: at 91% (early 1960s) it filled the dam; at 37% (2024) it lets the dam drain.
- The WWII comparison proves the narrative is wrong: in 1946, debt peaked at 118.9% of GDP — in 2024 it stood at 121.7%, above even that wartime peak. It fell for 34 years, with brief reversals, because the inflow valve was open. Debt is not the problem — the open drain is.
- Four measurable indicators track the dam’s health: Government Debt (% GDP), Top 1% Income Share, Public Investment (% GDP), Top Marginal Tax Rate — all four tell the same story: the dam has been draining since 1980.
In 1946, the U.S. national debt stood at 118.9% of GDP — and over the next thirty-four years, it fell by nearly three-quarters. Nobody cut Social Security. Nobody cut schools.
How is that possible? The question every news cycle asks — “how will we ever pay this off?” — has a precise answer. It is not the one being given.
A climate scientist learns to read flow systems. A river, a watershed, an atmosphere. You track what comes in, what goes out, and how the system fills or drains. The math is ruthless and public.
The U.S. economy is a flow system. Not a metaphor, a structural description. Like every flow system, it obeys the Law of Continuity. If inflow exceeds outflow, the system accumulates. If outflow exceeds inflow, the system depletes. This is not theory. This is physics.
The national debt is not the disease. It is the symptom. It is the visible measurement of an imbalance between inflow and outflow that has been widening for forty-five years.
This is how the economy actually works. To understand the debt, you must first understand the dam.
The dam translation: Picture a concrete dam holding the nation’s wealth. Water enters from above through the inflow valve, which is the tax code. Water exits at the bottom through the outflow pipe, which is public spending. From 1945 to 1980, those two flows balanced. Then a third pipe was drilled near the top — the elite pipe — and the reservoir began to fall. Debt is just the gauge on the wall recording the drop.
The Inflow: What Fills the Reservoir
The inflow is everything that puts money into the federal system. There are four primary sources.
Federal taxes — The largest inflow. When you earn income, buy goods carrying federal excise tax, or run a corporation, a portion flows to the federal government. The size of the inflow depends on tax rates and on who is actually paying them. (Source: OMB Historical Tables, Table 2.1)
Productivity and wage growth — When workers produce more value, they earn higher wages. Higher wages mean higher income taxes and higher consumer spending. A healthy economy with rising wages is an economy with rising inflow.
Public investment returns — When the government builds a highway or funds medical research through the NIH (the National Institutes of Health, which underwrites most basic biomedical science in the U.S.), the investment generates future commerce and future tax revenue. The Interstate Highway System, built in the 1950s, paid for itself many times over in commerce and growth.
Global trust in the dollar — The U.S. dollar is the world’s reserve currency, the default money other governments hold to settle international trade. That trust lets the U.S. borrow at lower interest rates than almost any other nation. It is not infinite. Trust can erode.
The Primary Control Valve: The Top Marginal Tax Rate
One lever has outsized importance. The top marginal tax rate is the percentage paid on the highest slice of income, the last dollar a wealthy person earns.
In 1963, that rate was 91% — applied to income above the top bracket threshold, meaning the highest earners returned the large majority of each additional dollar earned above that threshold to the public system. It sounds punitive. The wealthy still became extraordinarily wealthy. They just did not accumulate it at the expense of the system holding them up. The rate made taking ever more money out as personal income less attractive; it was more rational to keep it in the business — invested in production and in the workers — where it stayed inside the shared reservoir. Money reinvested in their own companies supported production and workers, while the owners could still build wealth; what fell was their share of the nation's income. The top rate did not touch money kept in the company: profits left in the business paid the corporate tax instead, and spending on wages, machines and research reduced even that.
When the rate was 91%, the inflow was massive. The reservoir filled from above.
Today the top rate is 37%. On $10 million, the wealthy keep $6.3 million. Only $3.7 million returns to the system.
The difference is not marginal. It is structural. The valve that kept the dam full was systematically closed, beginning in 1981. (Source: Tax Policy Center, Historical Highest Marginal Income Tax Rates)
The dam translation: The inflow has many sources, but the valve that controls whether the wealthy feed the system or starve it is the top tax rate. When that valve is open, the dam fills even as the wealthy accumulate real wealth. When it is closed, the wealthy keep more, and the dam drains.
The Outflow: What the Dam Is Designed to Provide
The outflow is everything the federal government spends money on — everything the dam is designed to provide to the American people.
Public Education — Federal and state investment in K–12 schools and public universities. Students now carry far more of the cost: net tuition rose from 35.8% of public colleges' educational revenue in 2008 to 46.6% in 2018. (Source: SHEEO, State Higher Education Finance FY2018) As public funding has been cut, students have taken on debt instead of education being a public good.
Infrastructure — Roads, bridges, water systems, power grids, ports. These are not luxuries; they are the foundation upon which all private commerce operates. A truck cannot move goods without roads. A factory cannot operate without reliable electricity and water. (Source: American Society of Civil Engineers, Infrastructure Report Card)
Defense — The military, intelligence services, and veterans’ benefits. Whether you believe current defense spending is right or wrong, it is an outflow that cannot be ignored.
Healthcare — Medicare (for the elderly), Medicaid (for the poor), and public health initiatives (CDC, NIH). Today, tens of millions of Americans depend on Medicare for survival.
Science and Research — NIH funding for medical research, NSF funding for basic science, NOAA funding for climate and weather monitoring, NASA space exploration. Public research dollars contributed to 354 of the 356 drugs the FDA approved from 2010 through 2019.
Social Security — Retirement payments for the elderly, disability insurance. Without it, about 37% of elderly Americans would live in poverty. (Source: Social Security Administration)
Safety Net Programs — Food assistance, housing assistance, child care assistance. These are small compared to the major categories, but they are the floor below which people do not fall.
This is not charity. This is maintenance.
A society is a production machine. Educated workers produce more. Reliable infrastructure carries more commerce. Social Security keeps an aging population out of destitution. Public research seeds the medicines of the next generation.
The outflow is the system investing in its own capacity to produce. (Source: BEA, gross government investment ÷ GDP)
When the outflow falls, the system deteriorates. Schools weaken. Bridges crack. Future productivity drops. Future tax revenue drops. The debt begins to compound on its own.
The dam translation: The outflow is the maintenance budget of the dam itself. Cut it, and the concrete cracks. Cutting outflow while the inflow valve is already closed is like firing the inspectors and the repair crew on the same day you discover the drain.
The Elite Pipe: Four Groups, Fourteen Channels
The elite pipe is not one policy and it is not one comparable dollar series. The latest episode organizes the evidence into four functional groups so that each channel can be judged on its own terms. Figure 2.1 maps the four groups and the fourteen channels beneath them.
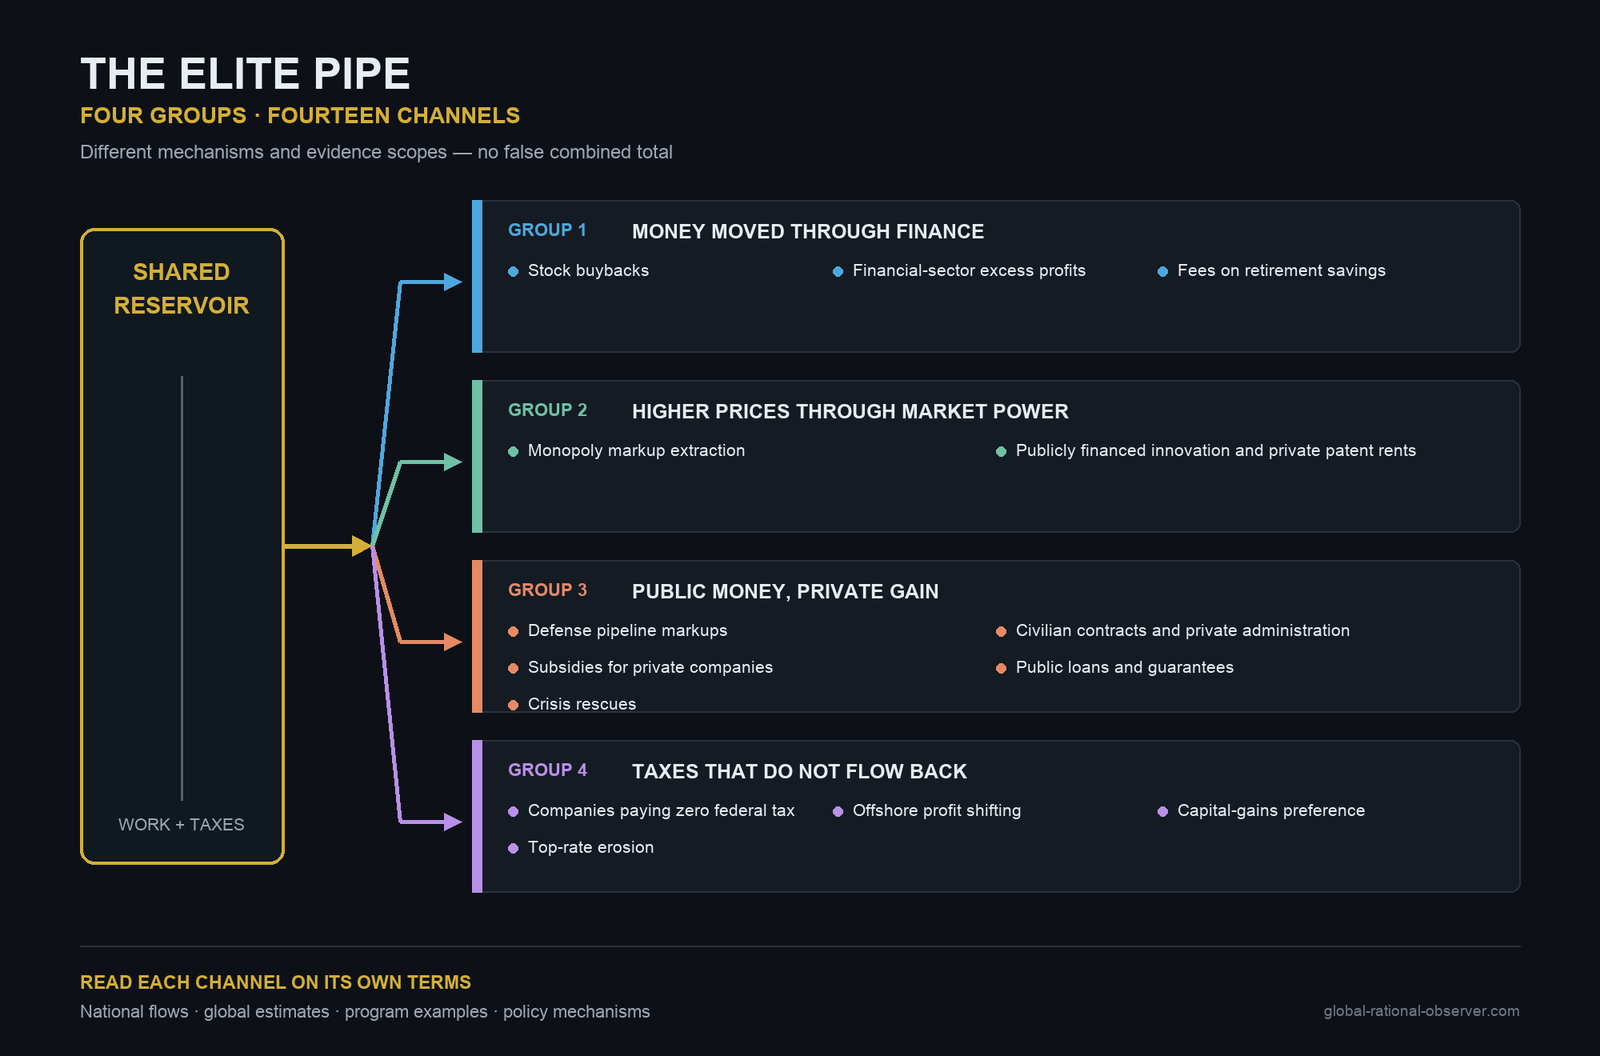
The dam translation: Think of the economy as a shared pool filled by everyone's work and taxes. It is supposed to flow back through wages, schools, infrastructure, healthcare, and safety nets. The drain has four main branches. Each branch contains several channels, and each channel must be measured with the evidence appropriate to it.
Group 1 — Money Moved Through the Financial System
The first group moves company profit and household savings through finance. Three channels belong here: stock buybacks, financial-sector excess profits, and fees on retirement savings.
1. Stock Buybacks
A stock buyback is when a company uses cash to buy back and retire its own shares. A company can raise wages, invest in the business, pay a dividend, or repurchase stock. Repurchasing leaves fewer shares, so the same profit looks larger per share and can raise the share price. The people who gain most are those who already own the most stock, especially executives paid in stock options.
William Lazonick explained in his 2014 Harvard Business Review article “Profits Without Prosperity” that the Securities and Exchange Commission's 1982 Rule 10b-18 gave companies legal protection for large-scale repurchases that regulators had previously treated as possible manipulation. S&P Global reported in 2025 that S&P 500 companies spent $942.5 billion on buybacks in 2024, a record.
2. Financial-Sector Excess Profits
This is the idea that the cost of banking and financial services should have fallen with better technology but did not. Economist Thomas Philippon reported in the American Economic Review that the cost of moving and managing money remained around 1.5% to 2% of the money involved for nearly a century.
For households, this does not appear as one dramatic invoice. It is dispersed through mortgage rates, account charges, and investment fees, each small enough to overlook but persistent enough to matter over a lifetime.
3. Fees on Retirement Savings
Managing retirement savings is a real service, and a fair fee is not a drain. But even a small fee is charged again every year. Over a working life, it adds up. The U.S. Department of Labor gives an example in which increasing the annual fee from 0.5% to 1.5% leaves a worker with 28% less after 35 years. This is an illustrative example, not a national total. Fees have also fallen in many plans since 2012. The drain begins when people pay more than the service is worth.
Group 2 — Higher Prices Through Market Power
The second group works through market power. When competition is weak, a company can charge more. Patent rights can also turn publicly supported knowledge into private profit.
4. Monopoly Markup Extraction
This is when a company with little competition charges more than a fair price because customers have few alternatives. De Loecker, Eeckhout, and Unger reported in the Quarterly Journal of Economics that average U.S. markups rose from about 21% in 1980 to about 61% by 2016.
The additional price does not necessarily buy a better product or service. It falls hardest on households that spend most of their income on ordinary necessities, and there is no guarantee it reaches the workers producing those goods.
5. Publicly Financed Innovation and Private Patent Rents
Public research can create valuable inventions, and private companies can turn them into useful products. Under current law, recipients of federal research funding may retain qualifying patent rights while the government retains certain rights of its own. This can help bring inventions to market; it is not automatically a drain.
The distributional problem appears when taxpayers finance the research and then face a high exclusive-patent price without adequate access, royalties, pricing conditions, or another public return. Medicines provide the clearest example. Cleary and colleagues found that NIH funding contributed to 354 of 356 drugs approved by the FDA from 2010 through 2019, involving $187 billion in NIH funding from 2000 onward. Patients can therefore pay once through taxes and again when they need the medicine.
Group 3 — Public Money and Public Protection Converted into Private Gain
The third group begins with legitimate public purposes. Government buys services, supports investment, guarantees loans, and rescues the economy. The drain is the extra private gain left when the public receives no fair return.
6. Defense Pipeline Markups
Defense procurement provides real public capability. The drain appears where weak competition allows excessive prices. GAO has repeatedly documented costs running over budget and schedules slipping in major weapons programs.
A Defense Department Inspector General review examined 47 aircraft spare parts sold by TransDigm and found excess profit on 46 of 47 parts, ranging from 17% to 4,451% (DODIG-2019-060). A later audit found at least $20.8 million in excess profit across 105 parts. These are documented examples, not estimates for the entire defense budget. Every dollar lost to an inflated price is a dollar that did not purchase defense capability.
The war with Iran shows what those prices mean once the equipment is used. CBO estimated the war had cost the Pentagon $38.1 billion by 1 August 2026, more than half of it — $21.7 billion — simply replacing what had been fired (CBO, Estimating the Cost of Combat Operations Against Iran, September 2026). Since June 2025 the United States has used between one-half and two-thirds of its inventory of Patriot, THAAD, SM-3 and SM-6 interceptors, and rebuilding those stocks would take at least five years even if production rates increase. Fourteen months to spend; five years to replace. The price per unit decides how many units a budget buys. Spending at these prices does not make a country stronger. It leaves it thinner.
That money was not raised in taxes. The administration asked Congress for an $87.6 billion supplemental, $67.1 billion of it for defense. The cost arrives as debt, repaid later through taxes on wages or pressure on public programs. The people who pay the price are not the people who set it. CBO notes that the Department of Defense did not respond to its requests, so these figures rest on public records.
7. Civilian Contracts and Private Administration
Government needs private companies to supply many goods and services. That is normal. Federal contracts totaled $755 billion in 2024, about $310 billion through civilian agencies. Those figures show the size of the pipe, not the size of the drain.
The drain begins where competition is absent, suppliers cannot be changed, or government pays more than the service is worth. MedPAC estimated that Medicare Advantage plans would receive $84 billion more in 2025 than comparable patients would cost in traditional Medicare. MedPAC explicitly cautions that this difference is not all profit; some finances additional benefits. It nevertheless shows why the public return must be measured.
8. Subsidies for Private Companies
A subsidy can build a factory, protect an important industry, or create jobs, so it is not automatically a drain. But the public needs something clear in return. In one large study, the average deal offered $178 million for 1,500 promised jobs. The researchers found some direct job gains but no strong evidence of broader local economic growth.
The drain is the public money lost when promised jobs do not arrive, the investment would have happened anyway, or the company keeps the gain without repaying the public.
9. Public Loans and Guarantees
Government can make borrowing cheaper by accepting part of the risk. CBO expected federal programs to support $1.9 trillion in loans and guarantees in 2025. The normal budget method estimated a lifetime cost of $2.4 billion. A fair-value method using the same projected cash flows but also pricing market risk estimated $65.2 billion.
The fair-value estimate does not mean taxpayers will lose $65.2 billion in cash. It measures the market value of the protection supplied by the public. The drain begins when private owners keep the gain without paying a fair price for that protection.
10. Crisis Rescues
Emergency support can stop a financial collapse and protect employment, and some rescues are repaid. Through TARP's bank programs, Treasury invested $245.5 billion and recovered $275.9 billion by September 2023. That program was not a simple one-way loss.
Repayment is only part of the mechanism. In 2020, the Federal Reserve promised support for the corporate-bond market. The promise alone helped borrowing costs fall across a much larger market. The public protected the system. The episode therefore asks: when private asset values recover, does the public receive a fair part of the gain it helped create?
Group 4 — Taxes That Do Not Flow Back
The fourth group weakens the return flow. More income reaches the top, but less returns through taxes to refill the shared reservoir.
11. Companies Paying Zero Federal Tax
This is when a profitable company uses legal tax provisions to reduce its federal corporate-income-tax bill to zero. ITEP reported in April 2026 that at least 88 major corporations paid no federal income tax in 2025 despite $105 billion in combined profit. At the ordinary 21% corporate rate, the counterfactual tax would have been $22.1 billion.
Workers generally cannot postpone or eliminate withholding from each paycheck in the same way. When profitable companies contribute nothing, the difference is covered through borrowing, other taxes, or pressure on public programs.
12. Offshore Profit Shifting
This is when a company books profit in a low-tax jurisdiction rather than where the underlying economic activity occurred. The EU Tax Observatory reported in 2024 that the resulting loss has remained around 10% of global corporate-tax revenue despite reform efforts. Its research program estimates that approximately $1 trillion in corporate profit is shifted globally each year.
This is a global estimate, not a confirmed U.S.-only amount. That distinction matters. Wages generally cannot be moved between jurisdictions as easily as accounting profit, so the missing tax flow is covered by borrowing or by taxes on less mobile income.
13. Capital-Gains Preference
This is the rule that taxes income from investments at a lower rate than income from work. The Joint Committee on Taxation (JCX-48-24, December 2024, Table 1) estimates the cost at $236.8 billion in fiscal year 2024 — one of the largest tax breaks it tracks.
The preference is not a hidden loophole. It is written into the tax code and primarily benefits households that receive substantial income from assets rather than wages.
14. Top-Rate Erosion
The top marginal individual income-tax rate fell from 91% in the early 1960s to 37% today. CBO reported in January 2026 that the richest 1% share of pretax income rose from 9% in 1979 to 18% in 2022.
Think of the top rate as one important valve controlling how much high-end income flows back to the shared reservoir. As the rate fell, a larger share remained available for private accumulation while debt and relative tax pressure elsewhere increased.
What the Four Groups Do and Do Not Prove
These channels do not operate in the same way. Some move company profit toward asset owners. Some use market power to raise prices. Some turn public money or public protection into private gain. Some stop taxes from flowing back into the reservoir.
Not every payment to a company is a drain. A company may provide something useful and earn a fair return. Not every subsidy fails. Not every rescue loses money. The drain is the extra value that leaves the shared system and does not come back. Because the evidence uses different units and scopes, the fourteen channels must not be added into one false-precision annual total.
Debt: The Visible Symptom
When the inflow is less than the outflow plus the elite pipe drain, the government must borrow the difference.
This is not mysterious or particularly evil. If your household’s income is $100,000 per year but your expenses (mortgage, food, healthcare, property tax) are $120,000, you borrow $20,000. You go into debt. The debt is not the cause of the problem — it is the measurement that your income does not match your obligations.
The same is true for government. When the inflow does not cover the outflow plus the drain, debt accumulates.
This is where the historical comparison becomes critical.
The WWII Comparison: Proof That Debt Can Be Fixed
The dam translation: In 1946, America carried debt at 118.9% of GDP — and brought it down to 32.6% without cutting programs, by opening the inflow valve. In 2024, at 121.7%, we have surpassed even that wartime peak. The same principle applies: the debt will fall when the inflow valve is opened. Until it opens, it will keep rising.
In 1946, after World War II, the U.S. national debt reached 118.9% of GDP — the highest point in American history to that moment. In 2024, at 121.7% of GDP, we have surpassed even that wartime peak. (Source: OMB Historical Tables 7.1)
This was a genuinely alarming situation. People at the time did not know what would happen. Would the economy collapse? Would inflation destroy the currency? Would the debt be permanent?
Instead, what happened over the next 34 years (1946–1980) was that the debt fell, with brief reversals. By 1980, it had fallen to 32.6% of GDP, near its lowest point in generations — an 86-percentage-point decline without cutting Social Security, without cutting education or infrastructure.
How did this happen? The inflow valve was opened.
The top tax rate stayed between 82% and 92% through the late 1940s and 1950s, at 91% until 1963, then at 70–77% until 1980. (Source: Tax Policy Center) The wealthy were taxed aggressively. The government collected enormous revenue. Using this revenue, the government:
- Did not cut Social Security
- Did not cut Medicare or education
- Instead, brought the debt ratio down
The debt fell because the problem was not the spending — the spending was creating the infrastructure, education system, and scientific base that made the post-war economy the most productive in the world. The debt ratio fell because the revenue matched the obligations — and a growing economy and postwar inflation shrank it further.
Today’s debt (121.7% of GDP in 2024) has exceeded even the WWII peak (118.9%). But the policy response has been entirely different.
The top tax rate is 37%, not 91%. The wealthy are not being taxed aggressively. The inflow valve is closed.
The rate did not stay frozen at its 1988 low, and that detour is itself evidence for the dam model. In 1990, President George H.W. Bush accepted an increase in the top rate from 28% to 31%. In 1993, President Bill Clinton raised it again, to 39.6%. Those increases restored revenue — combined with strong growth, spending restraint, and unusually high stock-market tax receipts, the federal budget moved into surplus and the debt ratio fell. Taxes were not the only cause, but restoring part of the inflow mattered. When those conditions changed, the upward debt trend resumed. (Source: Tax Policy Center, Historical Highest Marginal Income Tax Rates)
What has happened instead? The debt has risen. It will continue to rise as long as the inflow does not match the outflow plus the drain.
The debate about debt is often framed as: “Should we cut spending or raise taxes?”
The WWII comparison answers this: The WWII generation carried debt at 118.9% of GDP — and today’s debt at 121.7% has exceeded even that. They did not cut programs. They raised the inflow. And the debt ratio fell.
The problem is not the level of spending. The problem is the closed inflow valve.
The two-panel chart below (Figure 2.2) puts both eras side by side — same debt level, opposite trajectories, and the single policy difference that explains why.
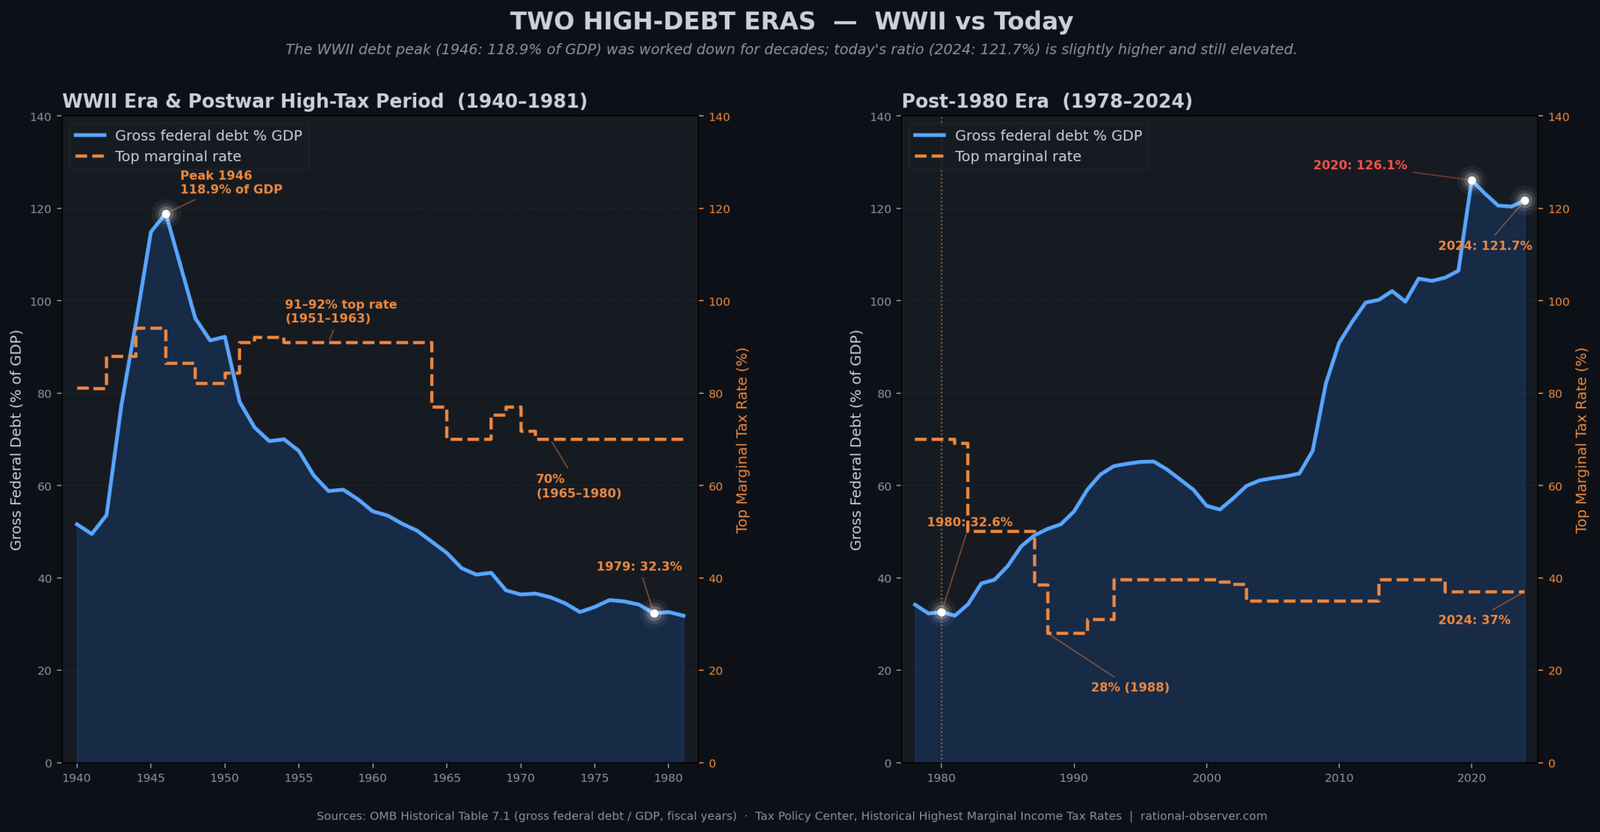
How to read Figure 2.2: This chart has two panels side by side, both measuring gross federal debt as a percentage of GDP with the top tax rate overlaid. The left panel (WWII and postwar era, 1940–1981) shows debt peaking at 118.9% in 1946, then falling, with brief reversals, to 32.6% by 1980, while the top rate stayed between 70% and 94%. The right panel (post-1980 era) shows debt climbing to a peak of 126.1% in 2020 and standing at 121.7% in 2024 — while the top rate collapses from 70% to 28% by 1988 and stays in the 28–39.6% range since. Same high debt level. Opposite trajectory. The difference tracks the tax-rate line.
The dam translation: Debt is not a disease. It is a measurement. The WWII generation brought debt down from 118.9% to 32.6% of GDP — without cutting programs — by opening the inflow valve. In 2024 we stood at 121.7%, above even that wartime level. The same mathematics applies: the debt will fall when the inflow valve is opened. Until then, it will rise. This is not a mystery or a moral failure — it is physics.
The Four Indicators: Reading the Health of the Dam
The dam translation: One indicator might be chance. Two might be coincidence. But four separate measurements all standing on the wrong side of 1980 and moving in the same direction? That is a system-wide structural shift. It is the moment the drain was opened.
At any point in history, four measurements tell you the complete state of the economic dam.
1. Government Debt (% of GDP) — This is the water level. It tells you whether the dam is filling or draining. Rising debt means outflow + drain exceeds inflow. Falling debt means the system is being repaired.
2. Top 1% Income Share — This is the size of the elite pipe. A 1% income share of 22% means the pipe is wide open. A share of 12% means it is narrower. This number tells you whether wealth is concentrating or distributing.
3. Public Investment (% of GDP) — This is whether the dam is being maintained. When public investment is 7% of GDP (1963 level), the system is being upgraded. When it is 3.6% (2024 level), it is being allowed to decay.
4. Top Marginal Tax Rate — This is the primary control valve. A rate of 91% (early 1960s) means the inflow is open. A rate of 37% (today) means it is closed.
These four numbers form a complete picture. They do not contradict each other. They all tell the same story.
The chart below (Figure 2.3) tracks all four at once, from 1929 to 2024 — all four stand on the wrong side of 1980.
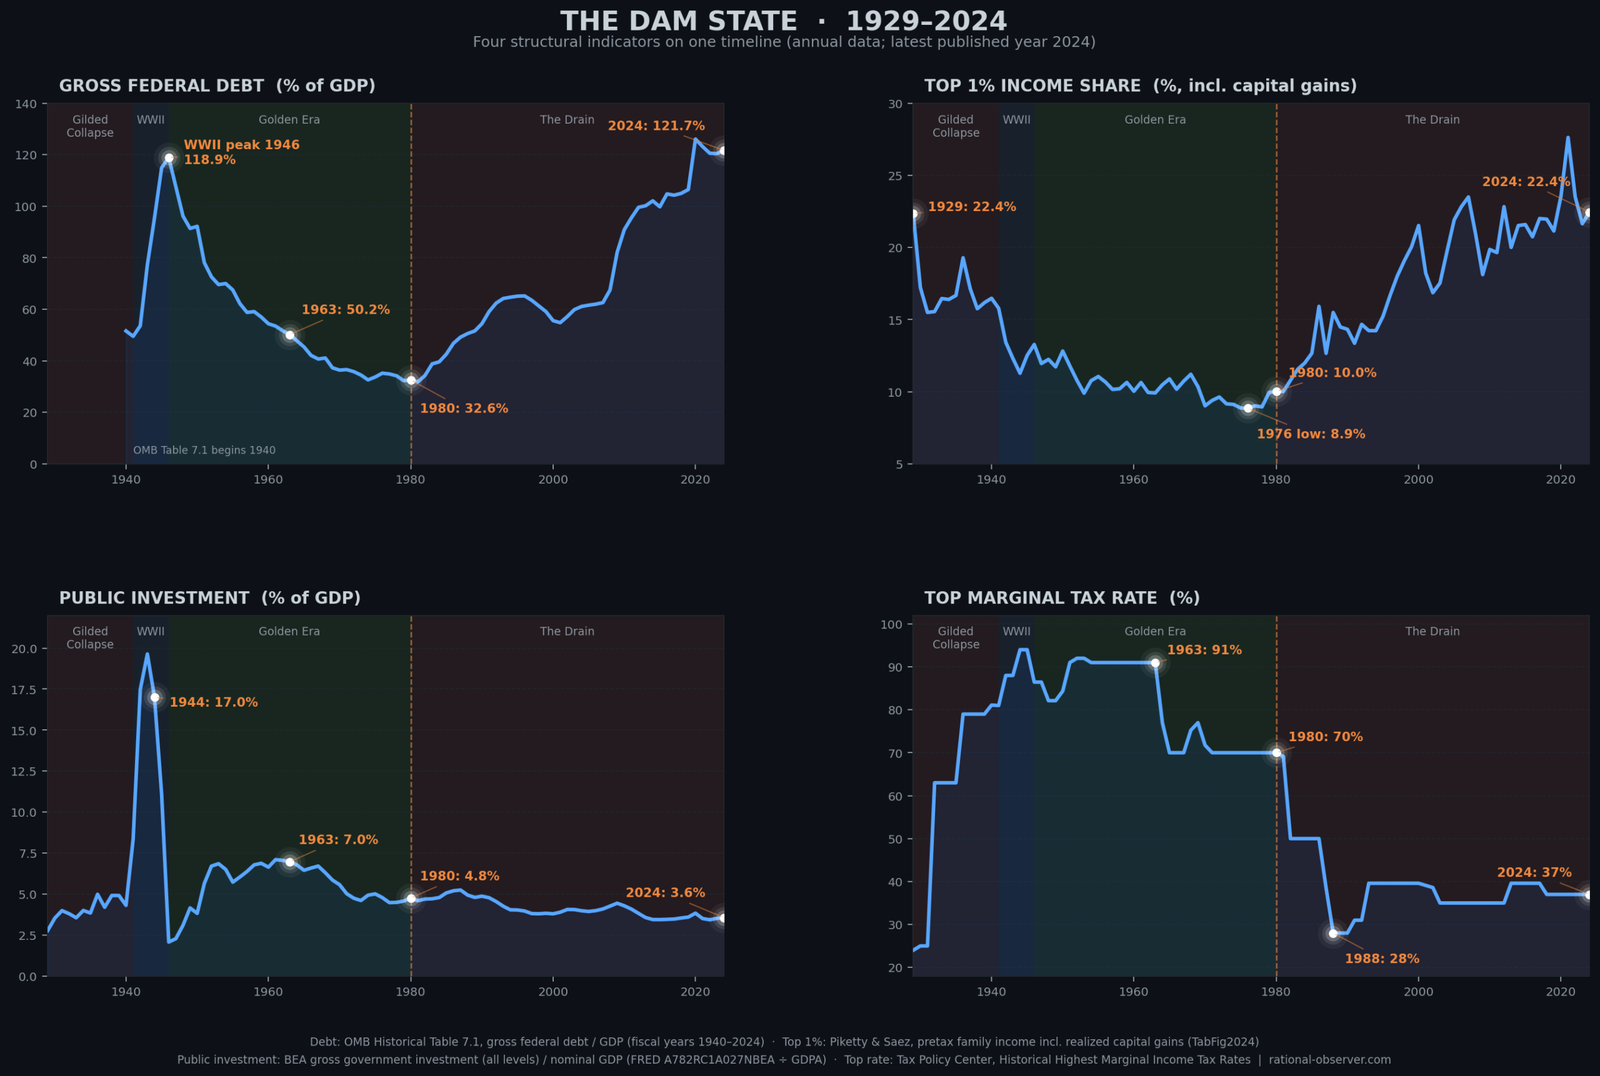
How to read Figure 2.3: Four panels laid out 2×2. Top left: government debt, from a WWII peak of 118.9% (1946) down to 50.2% by 1963, up to 121.7% in 2024. Top right: top 1% income share (pretax family income including realized capital gains), from 22.4% in 1929 down to an 8.9% low in 1976, back up to 22.4% in 2024 — exactly where it stood in 1929. Bottom left: public investment, reaching 17.0% of GDP during WWII (1944) and down to 3.6% in 2024. Bottom right: top marginal tax rate, 91% in 1963, 37% today. All four panels turn around 1980.
1963: The Dam was Strong
In 1963, government debt stood at 50.2% of GDP and was falling — the clearest sign of a system in balance: tax revenue matching public need, wealth circulating broadly.
Signal: Top rate: 91% | Top 1% share: 9.9% (near the 1976 low of 8.9%) | Public investment: 7.0% of GDP | Debt: 50.2% (falling)
The reservoir was full. The wealthy were taxed aggressively but still became wealthy. Public investment was robust. Debt was declining.
2024: The Dam is Draining
By 2024, government debt had climbed to 121.7% of GDP — the same four dials now pointing in the opposite direction.
Signal: Top rate: 37% | Top 1% share: 22.4% | Public investment: 3.6% of GDP | Debt: 121.7%
The reservoir is draining. The wealthy capture a larger share. Public investment is being cut. Debt is rising.
All four indicators point in the same direction. This is not coincidence. They are all measuring the same phenomenon: the opening of the drain since 1980. (Source: Tax Policy Center; Piketty & Saez, TabFig2024, including realized capital gains; BEA gross government investment ÷ GDP; OMB Historical Tables 7.1)
The dam translation: The dam’s health can be measured precisely. In 1963, all four indicators showed a strong, filling system. In 2024, all four show a draining system. There is no ambiguity. The physics is unmistakable. The dam is draining because the inflow valve is closed and the elite pipe is open.
Why the Debt Narrative is Wrong
You will often hear: “We can’t afford more spending. The debt is too high. We must cut programs.”
This narrative is precise in its misdirection. It is technically true (the debt is high) while being fundamentally wrong (the debt does not constrain the solution).
The WWII comparison destroys this narrative: The U.S. had debt at 118.9% of GDP and did not cut programs. It raised the inflow and brought the debt ratio down. Today’s debt at 121.7% has surpassed even that wartime level — and the same mathematics applies.
But here is why the narrative persists: It serves the interests of the wealthy. If the solution is “cut programs,” then Medicare gets cut, Social Security gets cut, education gets cut. Working people lose. If the solution is “raise taxes on the wealthy,” then the wealthy lose.
The narrative of debt-as-constraint is useful to those who wish to avoid taxation. It is politically convenient. It allows the powerful to say, “I would love to fund education, but the debt.” It allows cutting the dam’s output while keeping the drain open.
The physics of the dam does not care about political convenience. If inflow does not match outflow plus drain, debt accumulates. This is not opinion. This is mathematics.
The dam translation: The debt narrative blames the problem (debt) rather than the cause (the closed inflow valve and the open drain). If you blame the debt, the solution appears to be cutting the dam’s benefits. If you name the cause, the solution is to open the valve and close the drain. The narrative that persists is the one that serves the powerful.
The System is Designed. It Can Be Redesigned.
This is the critical realization: None of this is accidental.
The stock buyback mechanism was introduced in the 1980s when regulations were changed. The corporate tax rate was cut through deliberate policy. The preferential capital gains rate was sustained through political will. The offshore havens were opened through specific tax code provisions. The top tax rate was cut from 91% to 37% through explicit legislation.
Each mechanism was built. Each decision was made by people with power, in service of people with wealth, at the cost of people without it.
This also means: each mechanism can be rebuilt differently.
You cannot fix the dam without opening the inflow valve and closing the drain. But “opening the valve” does not mean some vague increase in taxation. It means specific policy: raising the top rate from 37% back toward 70% (not 91%, just to 70%), which would dramatically increase inflow. It means closing the drain: taxing stock buybacks, raising corporate taxes, eliminating capital gains preferences, shutting down offshore havens.
These are not hypothetical. These are not wishes. These are policies. Specific. Measurable. Implemented before. Repeatable.
And they do not require austerity. The WWII generation did not cut programs. They raised the inflow. The Golden Era (1945–1980) did not cut programs. They maintained investment while taxing the wealthy. The dam can be repaired without cutting the dam’s output.
But it requires understanding the mechanism. It requires naming the drain. It requires recognizing that the debt is not the problem — the drain is.
The dam translation: The dam was engineered to drain wealth upward. This was not an accident of nature. It was a deliberate design. Designs can be changed. But you must see the system clearly to imagine changing it.
What You Now Know
You understand the mechanism. You have seen the four components: inflow (taxes and wages), outflow (public goods), the elite pipe (systematic drain), and debt (the accumulating gap).
You understand that the four indicators — debt, inequality, public investment, and tax rates — all move together. When one rises, the others follow the same pattern. They are measuring the same phenomenon.
You understand the WWII comparison: the U.S. carried debt at 118.9% of GDP and fixed it by opening the inflow valve, not by cutting the dam’s output. Today’s debt at 121.7% has surpassed even that wartime peak — and the same solution applies.
You understand that debt is not the cause. It is the symptom. The cause is the closed valve and the open drain.
But understanding the mechanism is not the same as feeling it.
Numbers on a chart are one thing. The lived experience of people inside a draining dam is another.
What does it feel like to live inside a system where the scissors between wages and costs have been opening for forty-five years? What does it feel like to be told you have a job (therefore the economy is healthy) while you cannot afford a house (therefore you cannot survive)? What does it feel like to be part of the lowest unemployment in more than fifty years while being one medical emergency from bankruptcy?
That is Chapter 3 — and it may be the most important thing in this series.
Sources & Further Reading
Tax Policy: Tax Policy Center, Historical Highest Marginal Income Tax Rates — Comprehensive historical data on U.S. marginal tax rates from 1913 to present, showing the 91% peak rates of the 1960s and the current 37% rate. taxpolicycenter.org
Income Inequality (tax-return based): Piketty, Thomas & Emmanuel Saez — "Income Inequality in the United States, 1913–1998" (Quarterly Journal of Economics, 2003), with the authors' updated tables through 2024 (TabFig2024.xlsx) — the top 1% share of pretax family income including realized capital gains, the series plotted in Figure 2.3: 10.0% in 1980, 21.1% in 2019, 22.4% in 2024. eml.berkeley.edu/~saez
Income Inequality (CBO series): Congressional Budget Office, The Distribution of Household Income, 2022 (January 2026) — reports the top 1% share of income before transfers and taxes rising from 9% in 1979 to 18% in 2022, a third, independently measured series cited in the "Top-Rate Erosion" channel above. cbo.gov · Distribution of Household Income, 2022
Federal Debt and Budget: OMB Historical Tables — Official U.S. government budget data including Table 7.1 (Federal Debt at End of Year), FY2027 Budget edition — gross federal debt as a percentage of GDP, 1940–2024 (2025 onward are estimates): 118.9% in 1946, 32.6% in 1980, 121.7% in 2024; and Table 2.1 (Receipts by Source). whitehouse.gov/omb historical tables
Financial Sector Data: Federal Reserve Financial Accounts (Z.1) — Comprehensive quarterly data on financial sector assets, liabilities, and profitability, source for identifying excess profit margins and nonfinancial corporate business accounts. federalreserve.gov/releases/z1
Public Investment: BEA gross government investment (federal, state, and local — the investment line only, not the combined consumption-and-investment total; FRED A782RC1A027NBEA), divided by nominal GDP (FRED GDPA) — 7.0% in 1963, 4.8% in 1980, 3.6% in 2024. fred.stlouisfed.org · A782RC1A027NBEA
Education Funding: State Higher Education Executive Officers Association (SHEEO), State Higher Education Finance: FY2018 — net tuition's share of public institutions' total educational revenue rose from 35.8% (2008) to 46.6% (2018). shef.sheeo.org
Infrastructure: American Society of Civil Engineers, Infrastructure Report Card — Biennial assessment of U.S. infrastructure condition across all major categories (roads, bridges, water, energy, transit), with grades and funding gap estimates. infrastructurereportcard.org
Corporate Taxation: Congressional Research Service — "The U.S. Statutory Corporate Income Tax Rate" — Official analysis of the 52% (1952) to 21% (2017) decline in corporate tax rates and revenue impacts. congress.gov/crs-product/R47519
Monopoly and Market Concentration: De Loecker, Jan, Jan Eeckhout & Gabriel Unger, "The Rise of Market Power and the Macroeconomic Implications" — The Quarterly Journal of Economics, Vol. 135, Issue 2, May 2020 — Empirical evidence, drawn from firm-level Compustat data spanning the U.S. economy (not manufacturing alone), showing average markups rising from 21% (1980) to 61% (2016). academic.oup.com/qje
Capital Gains and Dividends Taxation: Joint Committee on Taxation — Estimates of Federal Tax Expenditures for Fiscal Years 2024–2028 (JCX-48-24, December 11, 2024), Table 1, "Reduced rates of tax on dividends and long-term capital gains": $236.8 billion for fiscal year 2024 (individuals), an estimated revenue loss under JCT's baseline. jct.gov · JCX-48-24 (PDF) jct.gov/publications
International profit shifting: EU Tax Observatory, Global Tax Evasion Report 2024 — Estimates that multinational companies shifted approximately $1 trillion in profits to tax havens in 2022, causing losses equivalent to nearly 10% of corporate-tax revenue collected globally. These are global figures, not U.S.-only estimates. taxobservatory.eu
Defense Contracting: Quincy Institute & Brown University Costs of War Project — "Profits of War: Top Beneficiaries of Pentagon Spending, 2020–2024" (2025) — Comprehensive study showing $771 billion to top five contractors and structural non-competitive procurement practices. watson.brown.edu/costsofwar
Congressional Defense Spending: Roll Call / Taxpayers for Common Sense — "Hill added $34 billion in unrequested defense program funds" (February 2026) and "Hill added $100 billion-plus since 2022 on unrequested weapons" (September 2025) — Tracking of congressional additions to defense budget beyond Pentagon requests, totaling $134+ billion since FY2022. rollcall.com
Federal Procurement Data: USAspending.gov — Official U.S. government database of all federal contracts, grants, and spending from FY2008 to present, searchable by agency, contractor, and program, source for Pentagon contract totals and contractor payments. usaspending.gov
Stock buybacks: S&P Dow Jones Indices, "S&P 500 Q4 2024 Buybacks Increase 7.4% and 2024 Expenditure Sets New Record" (March 2025); William Lazonick, "Profits Without Prosperity," Harvard Business Review, September 2014. spglobal.com · hbr.org
Cost of financial intermediation: Thomas Philippon, "Has the US Finance Industry Become Less Efficient? On the Theory and Measurement of Financial Intermediation," American Economic Review 105(4), 2015. aeaweb.org
Public funding of new drugs: Ekaterina Galkina Cleary, Matthew J. Jackson, Edward W. Zhou and Fred D. Ledley, "Comparison of Research Spending on New Drug Approvals by the National Institutes of Health vs the Pharmaceutical Industry, 2010-2019," JAMA Health Forum 4(4):e230511, 2023 — NIH funding from 2000 onward contributed to 354 of 356 drugs approved 2010–2019, $187 billion in total (83% basic research on drug targets). jamanetwork.com
Defense spare-parts audits: U.S. Department of Defense Inspector General, DODIG-2019-060 (review of 47 TransDigm spare parts) and DODIG-2022-043, Audit of the Business Model for TransDigm Group Inc. and Its Impact on Department of Defense Spare Parts Pricing (December 2021). dodig.mil · DODIG-2022-043 dodig.mil · DODIG-2019-060
Cost of operations against Iran: Congressional Budget Office, Estimating the Cost of Combat Operations Against Iran (September 2026) — the $38.1 billion estimate through 1 August 2026, the $21.7 billion munitions-replacement figure, and the estimate that between one-half and two-thirds of Patriot, THAAD, SM-3 and SM-6 inventories had been used since June 2025, with at least five years needed to rebuild them. CBO notes that the Department of Defense did not respond to its requests. cbo.gov · publication 62756
Zero-tax corporations: Institute on Taxation and Economic Policy (ITEP), "88 Profitable Corporations Paid Zero Income Tax in 2025" (April 2026). itep.org
Retirement-plan fees: U.S. Department of Labor, A Look at 401(k) Plan Fees, and GAO-24-107125, 401(k) Plans: Reported Impacts of Fee Disclosure Regulations. dol.gov and gao.gov/products/gao-24-107125
Federal contracting: U.S. GAO, A Snapshot: Government-Wide Contracting, FY2024. files.gao.gov · FY2024 snapshot
Medicare Advantage: MedPAC, March 2025, Chapter 11, The Medicare Advantage Program: Status Report. medpac.gov · March 2025, Ch. 11
Business incentives: Cailin Slattery and Owen Zidar, "Evaluating State and Local Business Incentives," Journal of Economic Perspectives 34(2), 2020. aeaweb.org
Federal credit: Congressional Budget Office, Estimates of the Cost of Federal Credit Programs in 2025. cbo.gov/publication/60682
TARP bank programs: U.S. Treasury, TARP Bank Investment Programs. home.treasury.gov · TARP bank programs
Corporate-credit facilities: Federal Reserve Bank of New York, Staff Report 935, It's What You Say and What You Buy. newyorkfed.org · Staff Report 935
Bayh-Dole framework: NIST Technology Partnerships Office, Bayh-Dole and federal technology transfer. nist.gov/tpo
Social Security and poverty: U.S. Census Bureau, Poverty in the United States: 2024 (Current Population Reports P60-287, 2025) — Social Security is the largest anti-poverty program under the Supplemental Poverty Measure, moving 28.7 million people of all ages out of SPM poverty in 2024 (Figure 10, Table B-7). census.gov · P60-287
Social Security and Elderly Poverty: Center on Budget and Policy Priorities, “Social Security Lifts More People Above the Poverty Line Than Any Other Program” (2024 data) — without Social Security, about 37% of the elderly would live in poverty. cbpp.org
Producer Price Data: U.S. Bureau of Labor Statistics, Producer Price Index (PPI) — Monthly and annual data on wholesale and retail price markups, trade service margins, and industry-specific pricing dynamics. bls.gov/ppi
Listen
A narrated audio briefing of this episode is available below.
Continue the Series
This is Chapter 2 of America's Wealth Drain, Part I — The Drain at Home. See the Part I overview, or continue directly to Chapter 3: The Invisible Depression.
Written by Rational Observer Global.
Topics: where does the money go · where American money goes · wealth drain · fourteen channels of extraction · stock buybacks · $942.5 billion buybacks 2024 · SEC Rule 10b-18 · financial sector profits · retirement fees · 401(k) fees · monopoly markups · market power · corporate profits · publicly funded drug research · NIH funded drugs · Bayh-Dole Act · drug patents · defense contractor markups · Pentagon spare parts · government contractors · Medicare Advantage overpayments · corporate subsidies · corporate welfare · government loan guarantees · bank bailouts · TARP · 2008 bailout · corporations paying zero federal tax · ITEP · offshore profit shifting · tax havens · capital gains tax · capital gains preference · top marginal tax rate · top tax rate 91% 1963 · tax cuts for the rich · World War II debt · WWII vs today debt · how America paid down WWII debt · public investment decline · infrastructure report card · public education funding · Social Security elderly poverty · top 1% income share · national debt · Bill Clinton · George W. Bush · America's Wealth Drain · four groups fourteen channels · elite pipe · four indicators 1929-2024 · federal debt to GDP · public investment share of GDP · 1963 vs 2024 · inflow and outflow · shared reservoir · extraction · elite extraction · debt narrative