
Most people do not feel the national debt as a number. They feel it when rent takes more of the paycheck, when a doctor's visit is postponed, and when groceries, insurance, housing and debt all rise faster than wages. So before asking how much America owes, we need to ask a harder question: where did the money go?
A Debt Without a War
After World War Two, the United States carried the largest debt in its history. The nation had just financed the most expensive military operation ever fought: four years of global war, paid for entirely with borrowed money.
Figure 0.1 shows U.S. federal debt as a share of GDP from 1929 to 2024. Debt as a share of GDP compares what the federal government owes with one year of everything the economy produces: at 100 percent, the debt equals a full year of national output. The dashed opening segment is a reconstruction for the Great Depression, based on Treasury debt outstanding; it rises from about 16 percent in 1929 to about 43 percent in 1939. From 1940 onward, the solid line is the official OMB measure of gross federal debt. The line climbs through the Great Depression and then rises steeply during World War Two.

Source: OMB Historical Tables, Table 7.1 (FY2027 Budget), gross federal debt as % of GDP, fiscal years 1940–2024. 1929–1939 (dashed): U.S. Treasury Fiscal Data, Historical Debt Outstanding ÷ BEA nominal GDP — a reconstruction with a different definition, not OMB data.
The highest point of the twentieth century came in 1946, when gross federal debt reached 118.9 percent of GDP, the peak of the World War Two debt cycle — more than a full year of national output.
Then something remarkable happened. For more than thirty years after that peak, the debt ratio fell, with only brief reversals. By the late 1970s, federal debt was down to about one third of GDP, the lowest level in the OMB record. The system was holding.
From 1980, when gross federal debt stood at 32.6 percent of GDP, the line in Figure 0.1 turns upward — slowly at first, then faster.
In 2024, gross federal debt stood at 121.7 percent of GDP, slightly above the 1946 World War Two peak (OMB Historical Tables, Table 7.1). This time there is no war and no mobilization — nothing anyone can point to and say: that is what they built, that is what they paid for. The reason seems invisible, but it is not: it has a structure and a direction, and that is what this series is about.
A Map of the System
To understand that structure, we need a map. The tools used to study climate and other flow systems help here: systems have rules; they do not behave randomly. If you understand the structure, you can predict what happens next.
The Economy Is a Flow System
The economy is a flow system, like air, electricity or blood. Every flow system in nature obeys what physicists call the continuity law: inflow must balance outflow for the system to stay in equilibrium. When the two do not balance, the system either fills beyond capacity or drains until it collapses.
Money flows in through taxes, wages, productivity and global trust in the dollar. It flows out through public services, infrastructure, wages and healthcare. A flow system can look stable for years while pressure builds inside it.
For the rest of this series, one simple picture is enough. Think of the economy as a reservoir. Work, technology, public investment and productivity keep filling it. Part of that flow should return to ordinary households through wages, public services, schools, healthcare and basic security. But over time another channel opens: before the water reaches the public system, part of the flow is redirected. That is the drain. This series follows it — where it came from, how it grew, and why a richer country can still leave millions of households under pressure.
For thirty-five years, from 1945 to 1980, the flow was balanced. The system was stable, and everyone drank from it. Then a structural drain opened. Since 1980, a pipe at the top of the system has been widening, carrying wealth upward and out of the general flow. In this picture, every year it drains more than the system puts back. The dam has responded by borrowing: debt has become the borrowed water that fills the gap. The debt is not the problem. The drain is.
Both Directions, One Structure
Tax policy moved both ways. Reagan-era laws cut the top individual rate from 70 to 28 percent. Clinton raised it from 31 to 39.6 percent. From 1993 to 2000, the budget moved from deficit to surplus and debt-to-GDP fell from 64.2 to 55.6 percent, though nominal debt rose; Clinton also signed financial deregulation.
George W. Bush cut the top rate from 39.6 to 35 percent. Obama restored 39.6 percent. From 2012 to 2016, the deficit narrowed, but debt-to-GDP rose from 99.6 to 104.8 percent. Trump cut the corporate rate from 35 to 21 percent. The outcomes differed, but the structure survived. The problem is not one politician. It is the design. (Sources: Tax Policy Center, Historical Highest Marginal Income Tax Rates; OMB Historical Tables, Table 7.1.)
When a politician says the economy is doing great, you will now be able to point to the exact pipe they are looking at — and see, precisely, which pipes they are ignoring. That map is the beginning of agency: once you understand the mechanism, you can imagine repairing it.
Four Measurements
Four measurements show when the drain opened and how far it had gone by 2024. Figure 0.2 places them on one timeline from 1929 to 2024, with 1980 marked as the turning point.
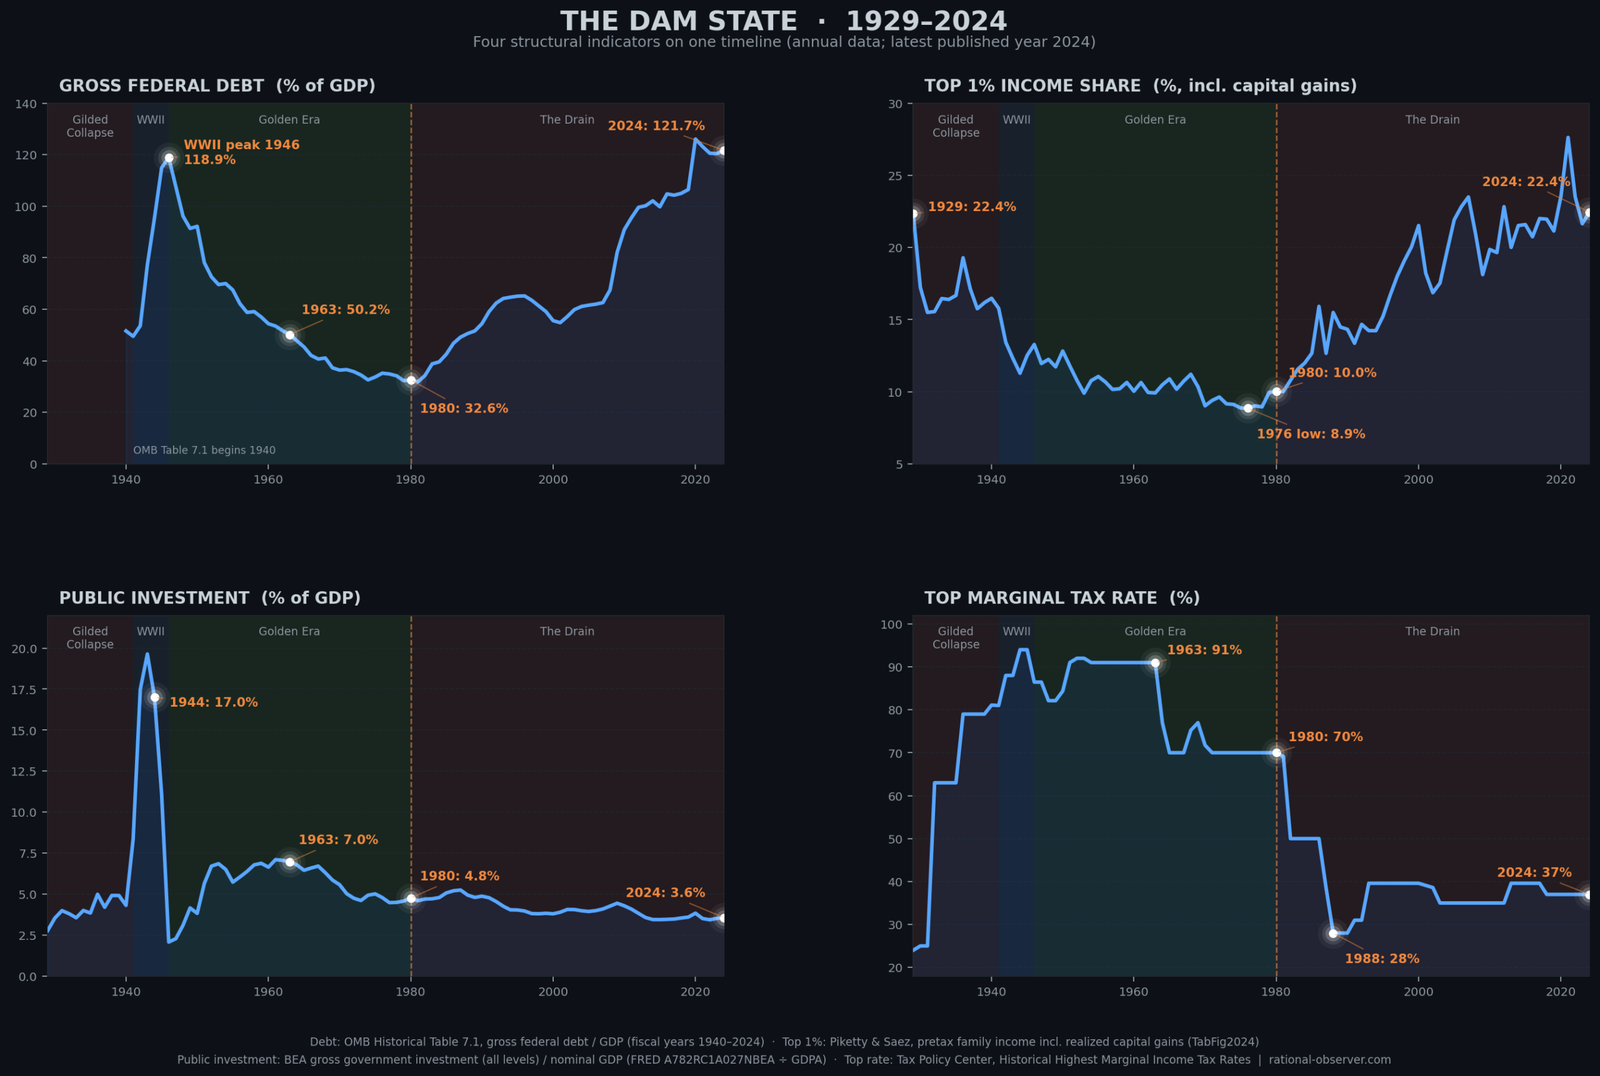
The first is gross federal debt as a share of GDP — the water level of the dam. In 1980, at the start of trickle-down policy — cutting taxes at the top on the promise that the gains would reach everyone — it stood at 32.6 percent, about one third and close to its postwar low. In 2024 it stood at 121.7 percent, nearly four times the 1980 level (OMB Historical Tables, Table 7.1).
The second is income concentration: the share of all pretax family income, including realized capital gains from selling assets, that goes to the top 1 percent of families. In 1980 that share was 10 percent; in 2024 it was 22.4 percent, substantially higher than in 1980 (Piketty and Saez, updated through 2024).
The third is public investment: what government at all levels spends on roads, schools, research and other assets that last, measured as a share of GDP. In 1980 it was 4.8 percent of GDP; in 2024 it was 3.6 percent (BEA, gross government investment).
The fourth is the top marginal income-tax rate: the rate paid only on the highest slice of taxable income, not on all of it. In 1980 it was 70 percent; in 2024 it was 37 percent (Tax Policy Center). Because it applied only to the highest slice of income, a high top rate made taking ever more money out as personal income less attractive and kept money in the business — invested in production and in the workers — inside the shared reservoir, while the owners could still build wealth. The top rate did not touch money kept in the company: profits left in the business paid the corporate tax instead, and spending on wages, machines and research reduced even that.
Forty-four years later, all four measurements had moved in the same adverse direction — not one or two of them, but all four.
That is not chance. That is a structural shift.
What Comes Next
The next chapters trace the mechanism itself — not the rhetoric, but the drain, its design, and the decisions that widened it.
This series will examine how the system was engineered to extract, and how that engineering can be reversed, because the historical record is clear. The alternative has been tried before. It produced thirty years of the most broadly shared growth in American economic history. And it can be tried again.
The policies will be named, the decisions dated, and the costs counted. The water is still there. The question is not whether the system can change — it changed before — but whether those who benefit from the drain will allow it to be repaired.
This series is the map.
This article is adapted for reading from the narration of the Episode 0 documentary. The full monograph carries the complete evidence and sources.
Sources
Figure 0.1 and every debt figure above are sourced to OMB Historical Tables, Table 7.1 (gross federal debt as a percent of GDP, 1940–2024); the dashed 1929–1939 segment is reconstructed from U.S. Treasury Historical Debt Outstanding and BEA nominal GDP. Full citations and the complete evidence review appear in the full monograph.
Written by Rational Observer Global.
Episode Media and Research Figures
Full Documentary
📚 Primary Sources & Verification Archive (Click to Expand Verified Datasets & Literature)
Two different debt measures exist, and this series is explicit about which one it uses. "Gross federal debt" (OMB Historical Table 7.1) is the measure used throughout this introduction and in Figure 0.1. A separate, commonly cited measure — "debt held by the public" — follows a similar shape but reaches lower peaks and a lower 1980 trough (roughly 26% rather than 32.6%). Both are legitimate, official measures; this series does not mix them within a single comparison.
"Paid down" does not mean "paid off." Federal debt declined sharply as a share of GDP after World War II. It was not reduced to zero, and outstanding nominal debt persisted throughout. This series describes the decline precisely as a share of the economy, not as a literal repayment of the underlying debt.
Correlation and documented mechanism are treated differently throughout this series. The specific channels named above — tax-rate changes, buyback rule changes, deregulation legislation — are each independently documented events with clear dates and legal texts. This introduction states that these developments accompanied the shift after 1980; it leaves the more detailed causal case, channel by channel, to the chapters that follow.
Topics: US national debt · national debt history · debt to GDP ratio · federal debt 1929-2024 · World War II debt · debt after WWII · why the economy feels broken · cost of living crisis · wealth inequality · income inequality USA · top 1% income share · top tax rate history · top marginal tax rate · tax cuts for the rich · 1980 economic turning point · stock buybacks · financial deregulation · Glass-Steagall repeal · offshore tax havens · public investment · middle class decline · median family income · medical debt · student debt · Great Depression · Social Security · Ronald Reagan · Bill Clinton · George W. Bush · Barack Obama · Donald Trump · Tax Cuts and Jobs Act 2017 · Piketty and Saez · OMB historical tables · systems thinking · America's Wealth Drain