
Democrats have won control of both houses of Congress in the 2026 midterm elections — projected on the night of 3 November, with several Senate races still close and no result yet certified. It is a major victory and a clear rejection of the direction taken by President Donald Trump and the Republican Party.
But history warns us against confusing an electoral victory with durable political power. Winning an election is an event. Building a coalition capable of governing, surviving political opposition, and improving ordinary people’s lives is a much larger project.
Here is the condition that decides which one this turns out to be:
A labor–political coalition remains durable only when elected leaders deliver enforceable rights and material gains for workers, and when organized labor remains independent enough to hold those leaders accountable.
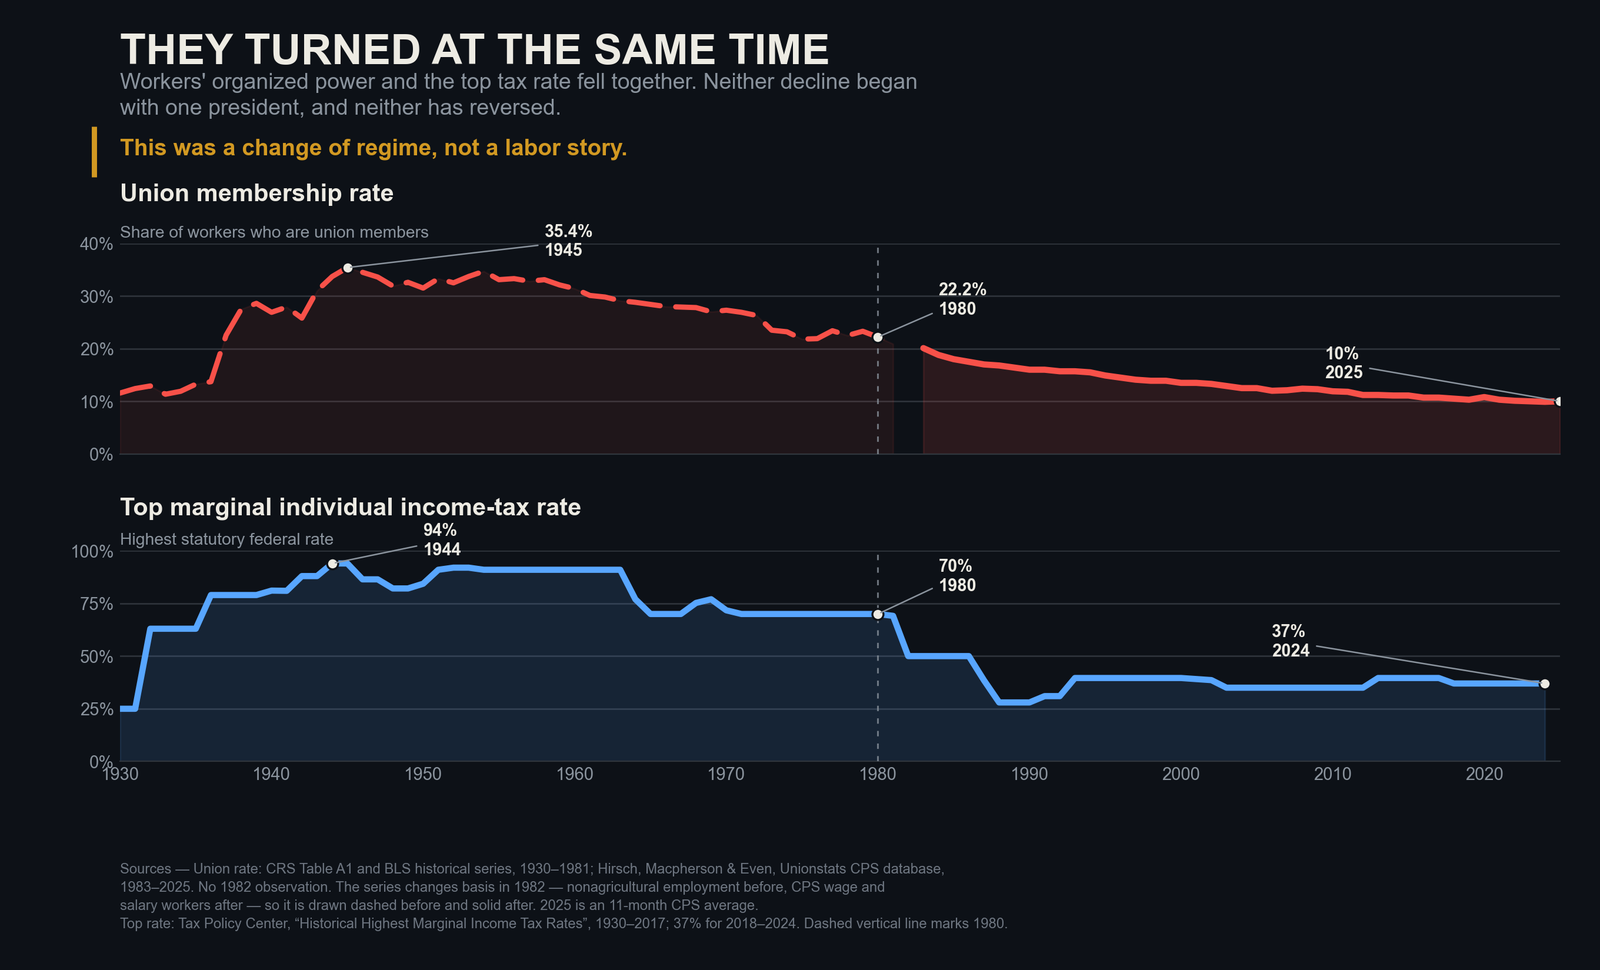
Politicians need organized workers, and organized workers need a government that protects democratic power in the workplace. Neither side can build durable reform alone. That condition is not currently met, and the reason is visible in a single chart.
Source: Union rate: CRS Table A1 and BLS historical series, 1930–1981; Hirsch, Macpherson & Even, Unionstats CPS database, 1983–2025. Top rate: Tax Policy Center, “Historical Highest Marginal Income Tax Rates”, 1930–2017; 37% for 2018–2024.
The decline started long before Reagan
In 1933, about 11 percent of nonagricultural workers belonged to unions. By 1945, roughly 35 percent did. By 2025, 10 percent of American wage-and-salary workers were union members.
But look at where the fall happened (Figure 1). Union density dropped 14.5 points between its 1945 peak and 1981 — the year Ronald Reagan dismissed the striking air-traffic controllers. It has fallen 10.9 points in the forty-four years since. More of the decline happened before Reagan than after him.
That single comparison rules out the most common explanation on offer this week. Whatever dismantled organized labor in America, it was not one president, and it did not begin in 1981. Four decades, both parties, and the line kept falling.
What that coalition was worth
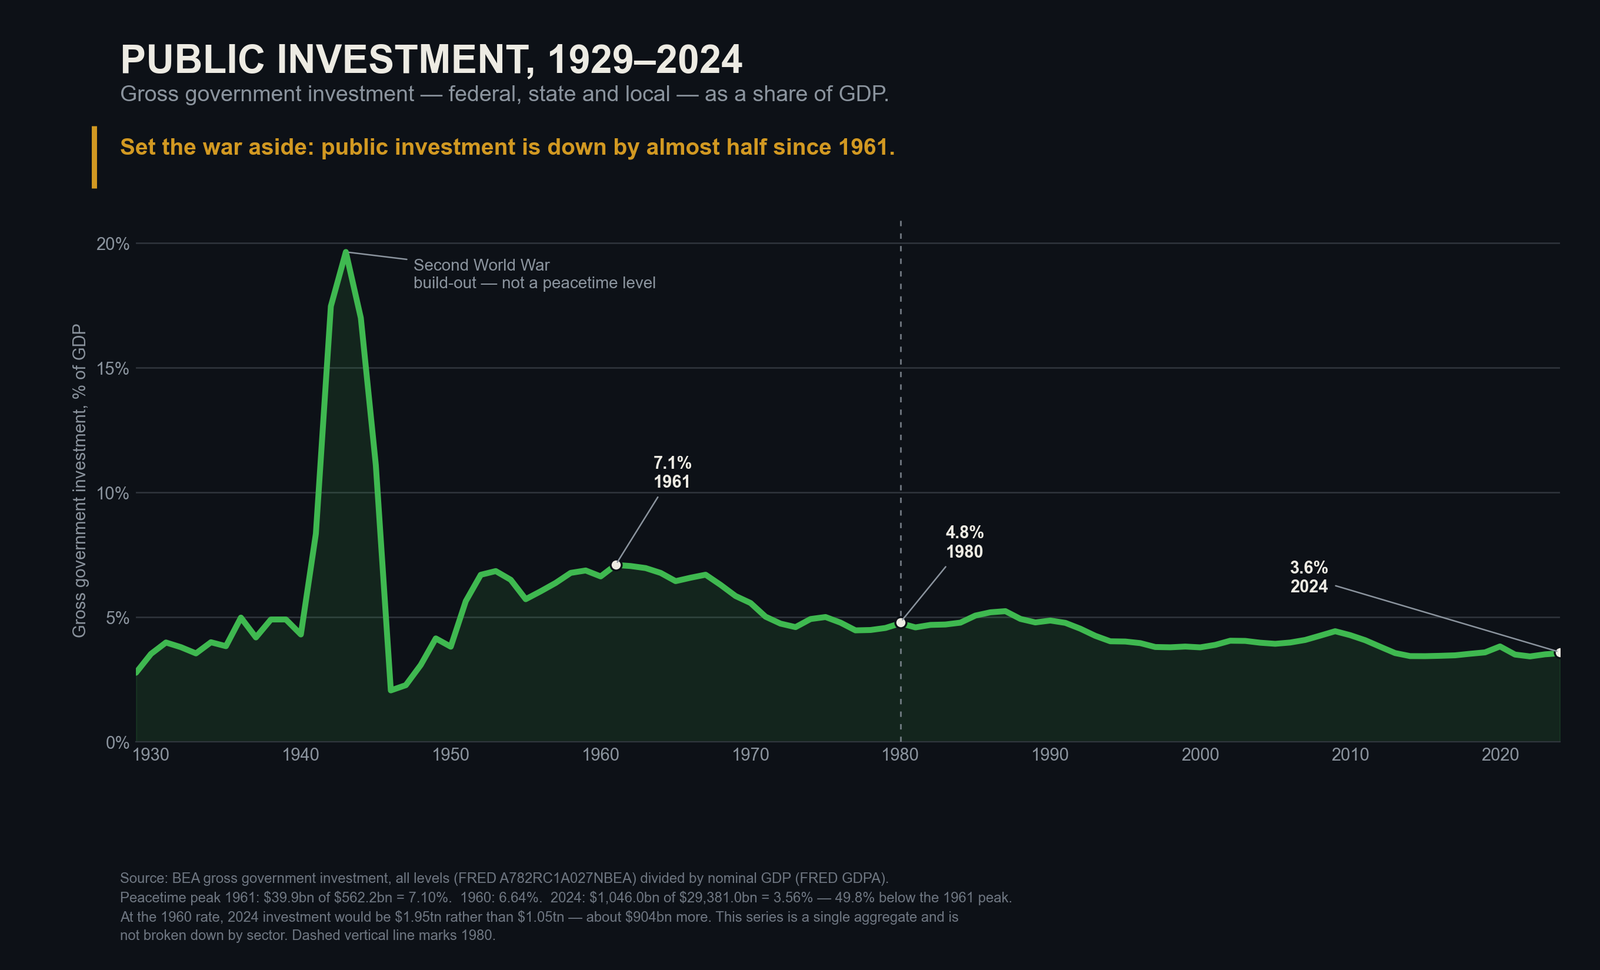
While it held, the top statutory rate on the highest incomes reached 94 percent and the richest one percent took about one dollar in eight. Today the top rate is 37 percent and that same one percent takes more than one dollar in five. Public investment — the schools, universities, clinics, transit and water systems a country runs on — peaked at 7.1 percent of GDP in 1961 and is 3.6 percent today — almost exactly half (Figure 2).
Source: BEA gross government investment, all levels (FRED A782RC1A027NBEA) divided by nominal GDP (FRED GDPA). Single aggregate; not broken down by sector.
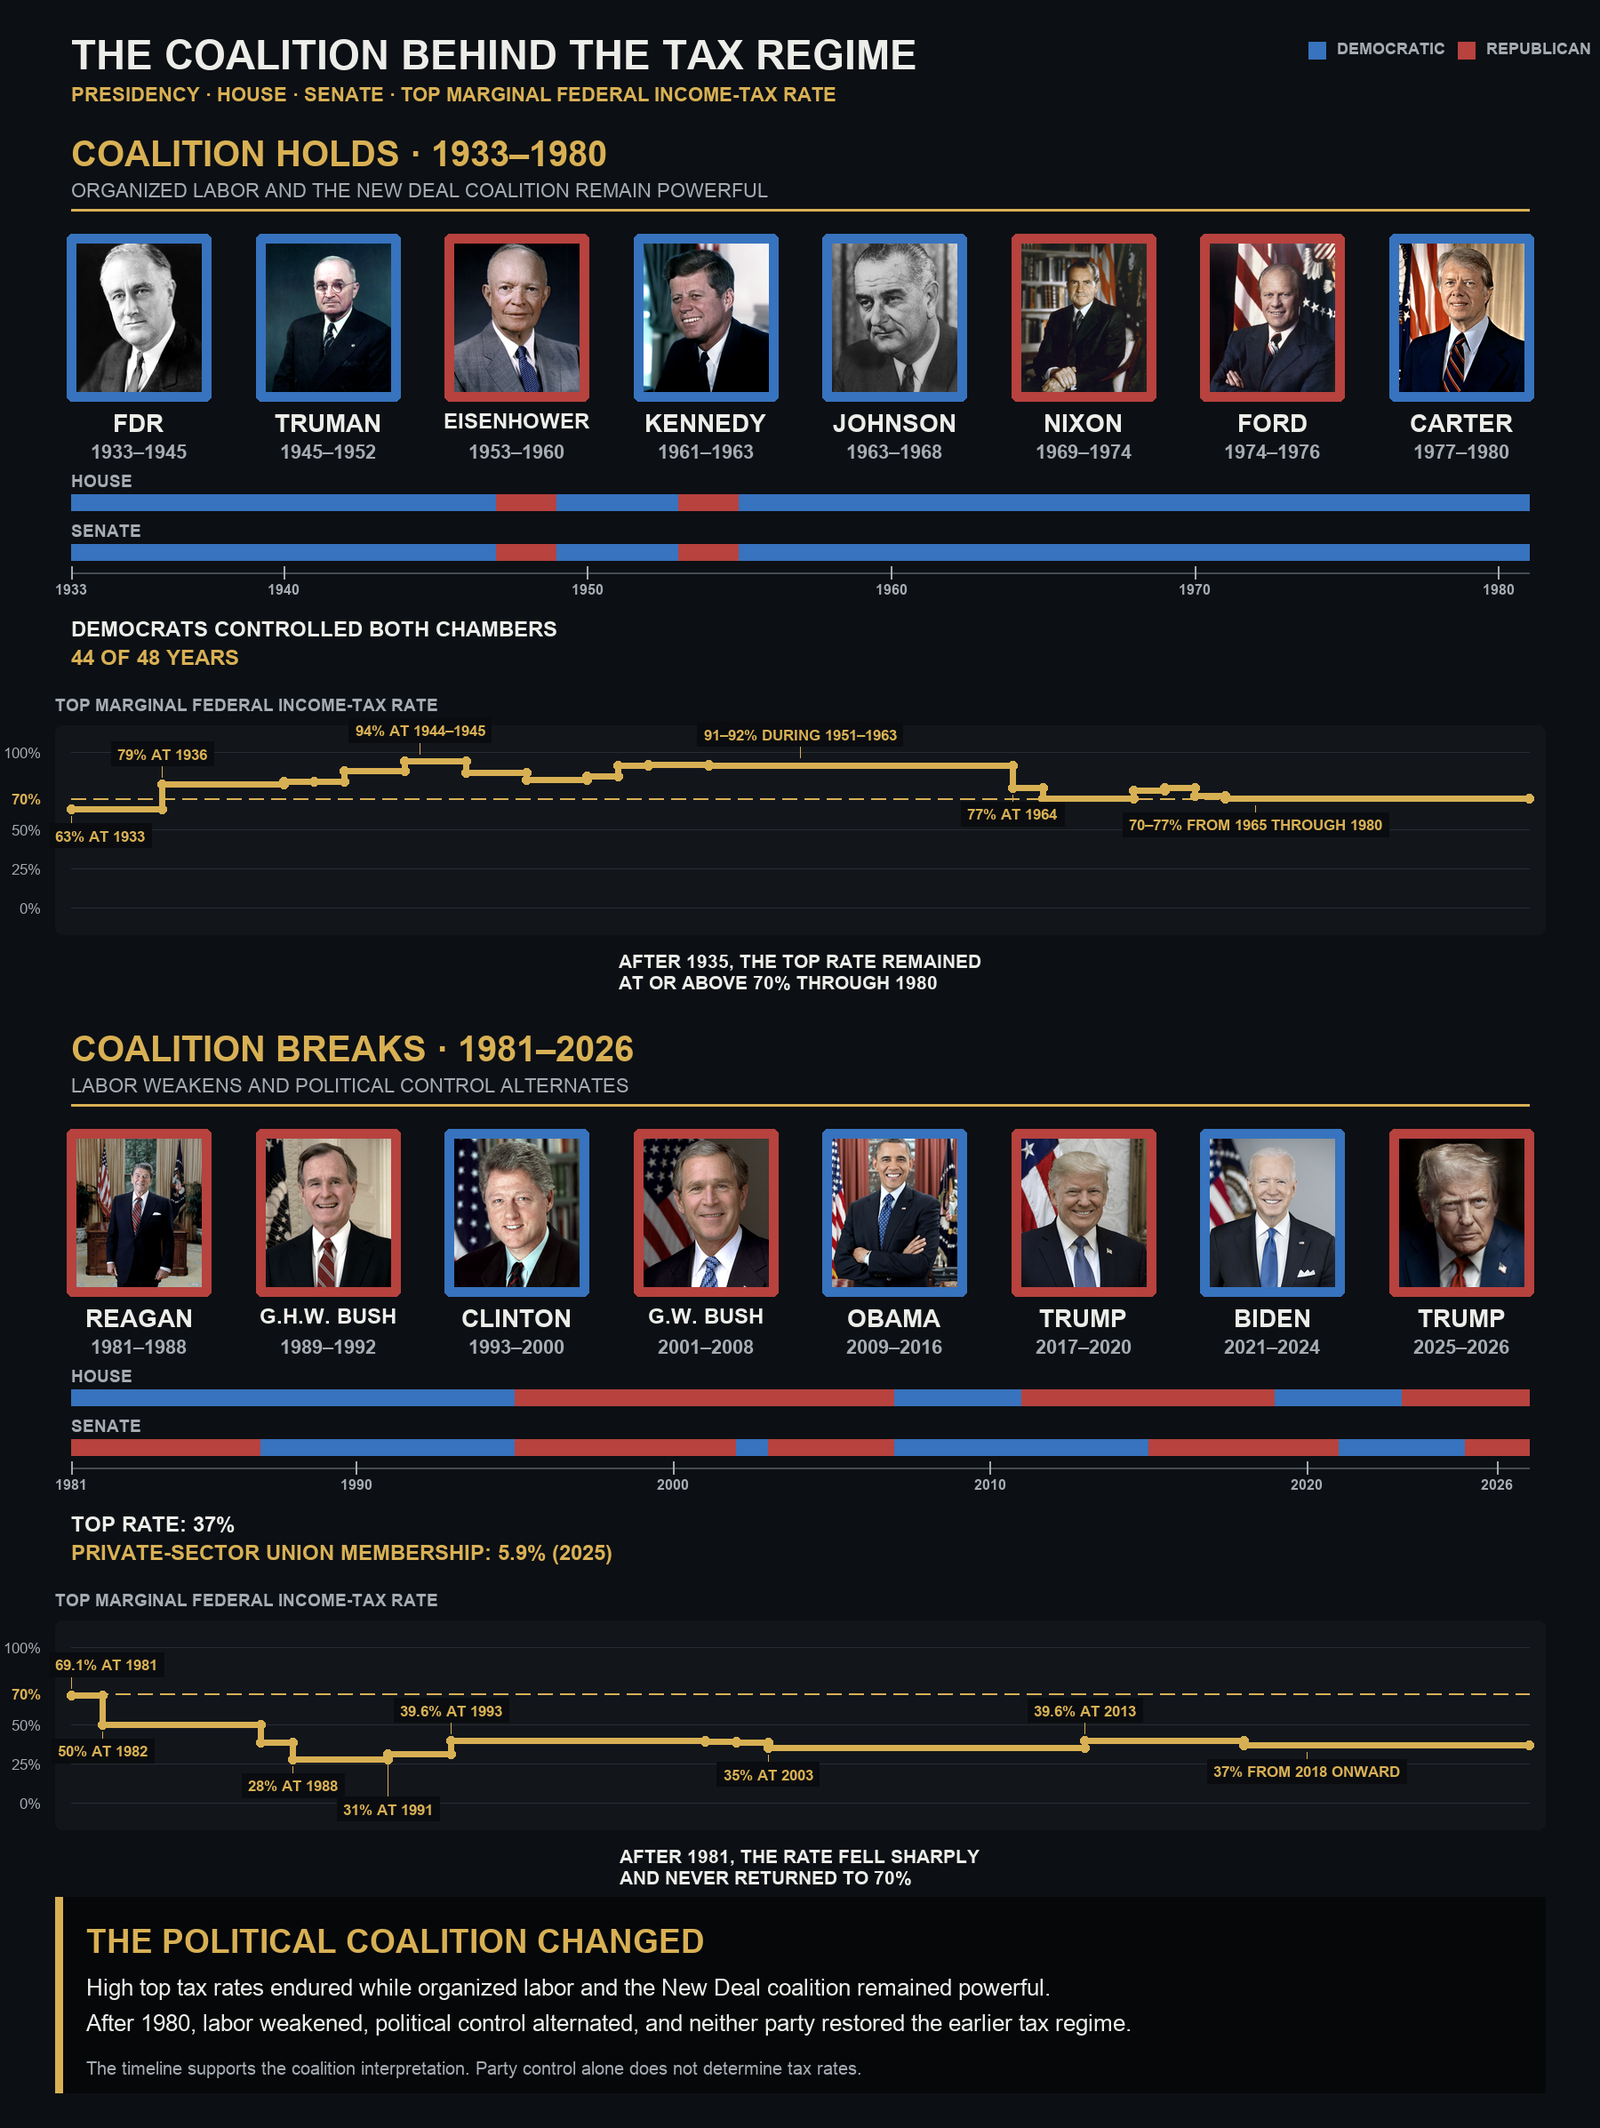
Democrats also controlled both chambers of Congress for 44 of the 48 years the coalition lasted. None of them cut the top rate below 70 percent. That is what an institutional connection to workers was worth, and it is what has been lost (Figure 3).
Source: U.S. House History, Art & Archives; U.S. Senate, “Party Division”; IRS SOI Historical Table 23; IRS tax-year 2026 inflation-adjustment notice; BLS, Union Members — 2025. Presidential portraits are U.S. federal or Library of Congress public-domain images.
What this victory is matters as much as that it happened. Trump remains in office and can block legislation, so these two years will be thin measured in bills passed. That is the wrong measure. A Congress that cannot legislate can still put the record of broken labor law in front of voters, force every politician to say where they stand, and pass the real reforms in the states it already governs. And it can spend two years helping workers organize rather than only asking them to vote — because the coalition that held for forty-four years was held together by membership, not by legislation. The honest test arrives before the next election: in 2028, not whether Democrats kept these seats, but whether union membership is higher than the ten percent they inherited.
Two paths, and only one has ever held
The first is the one the party already knows. Keep the donor base, keep the consultants, run on opposition to Trump, and treat 2028 as the real prize. We already know what this produces, because it is what the last forty years produced: narrow majorities that arrive and leave, and a policy line that never turns. Anger without organization is weather, not force — and so is an election night.
The second is the one that actually won — for both sides. While the coalition held, workers got Social Security, collective bargaining and the forty-hour week; the party got 44 of 48 years with both chambers. Neither was charity from the other. Labor delivered organized power, politicians delivered for workers, and each made the other stronger. Since it broke, neither side has had much of either. The costs fall on the donors, not on the party — a party funded by donors whose interests run against its voters’ cannot serve both, not because anyone is corrupt, but because the arithmetic does not close.
The future of both depends on rebuilding a coalition in which labor delivers organized power and politicians deliver for workers.
The full version sets out the whole history — the Wagner Act, Taft–Hartley, PATCO, and what each administration since has done — with the complete sources.
Episode Media and Research Figures
Topics: union membership · labor · Democrats · midterms · tax policy · public investment