
The Impossible Fact
In 2024, U.S. debt was about 122 percent of GDP. After World War II, it peaked at about 119 percent. The postwar recovery paid that debt down for decades. By 1980, it had fallen to around 33% of GDP, near its lowest point in generations. Then it started rising again. This time, there was no world war. And the country was not building a new middle class.
So what changed? The top tax rate fell from 70% to 37%. Public investment weakened from 4.8% of GDP to 3.6%. And a new drain opened above the dam. Figure 2.3 plots both debt paths and the top tax rate behind them, and Figure 2.4 places all four of these measures on one timeline.
The Continuity Law
The economy is a flow system. Like air. Like electricity. Like blood. Every flow system follows the same physical rule. This is known in physics as the continuity law. The inflow balances the outflow. When more enters than leaves, the system fills. The reservoir rises. When more leaves than enters, the system empties. The reservoir falls.
The U.S. economy is a flow system. Picture a concrete dam holding the nation's wealth. It has three components. An inflow, an outflow, and a drain. Understanding all three tells you everything the debt debate leaves out. Figure 2.1 translates this continuity rule into the economic dam used throughout this series.
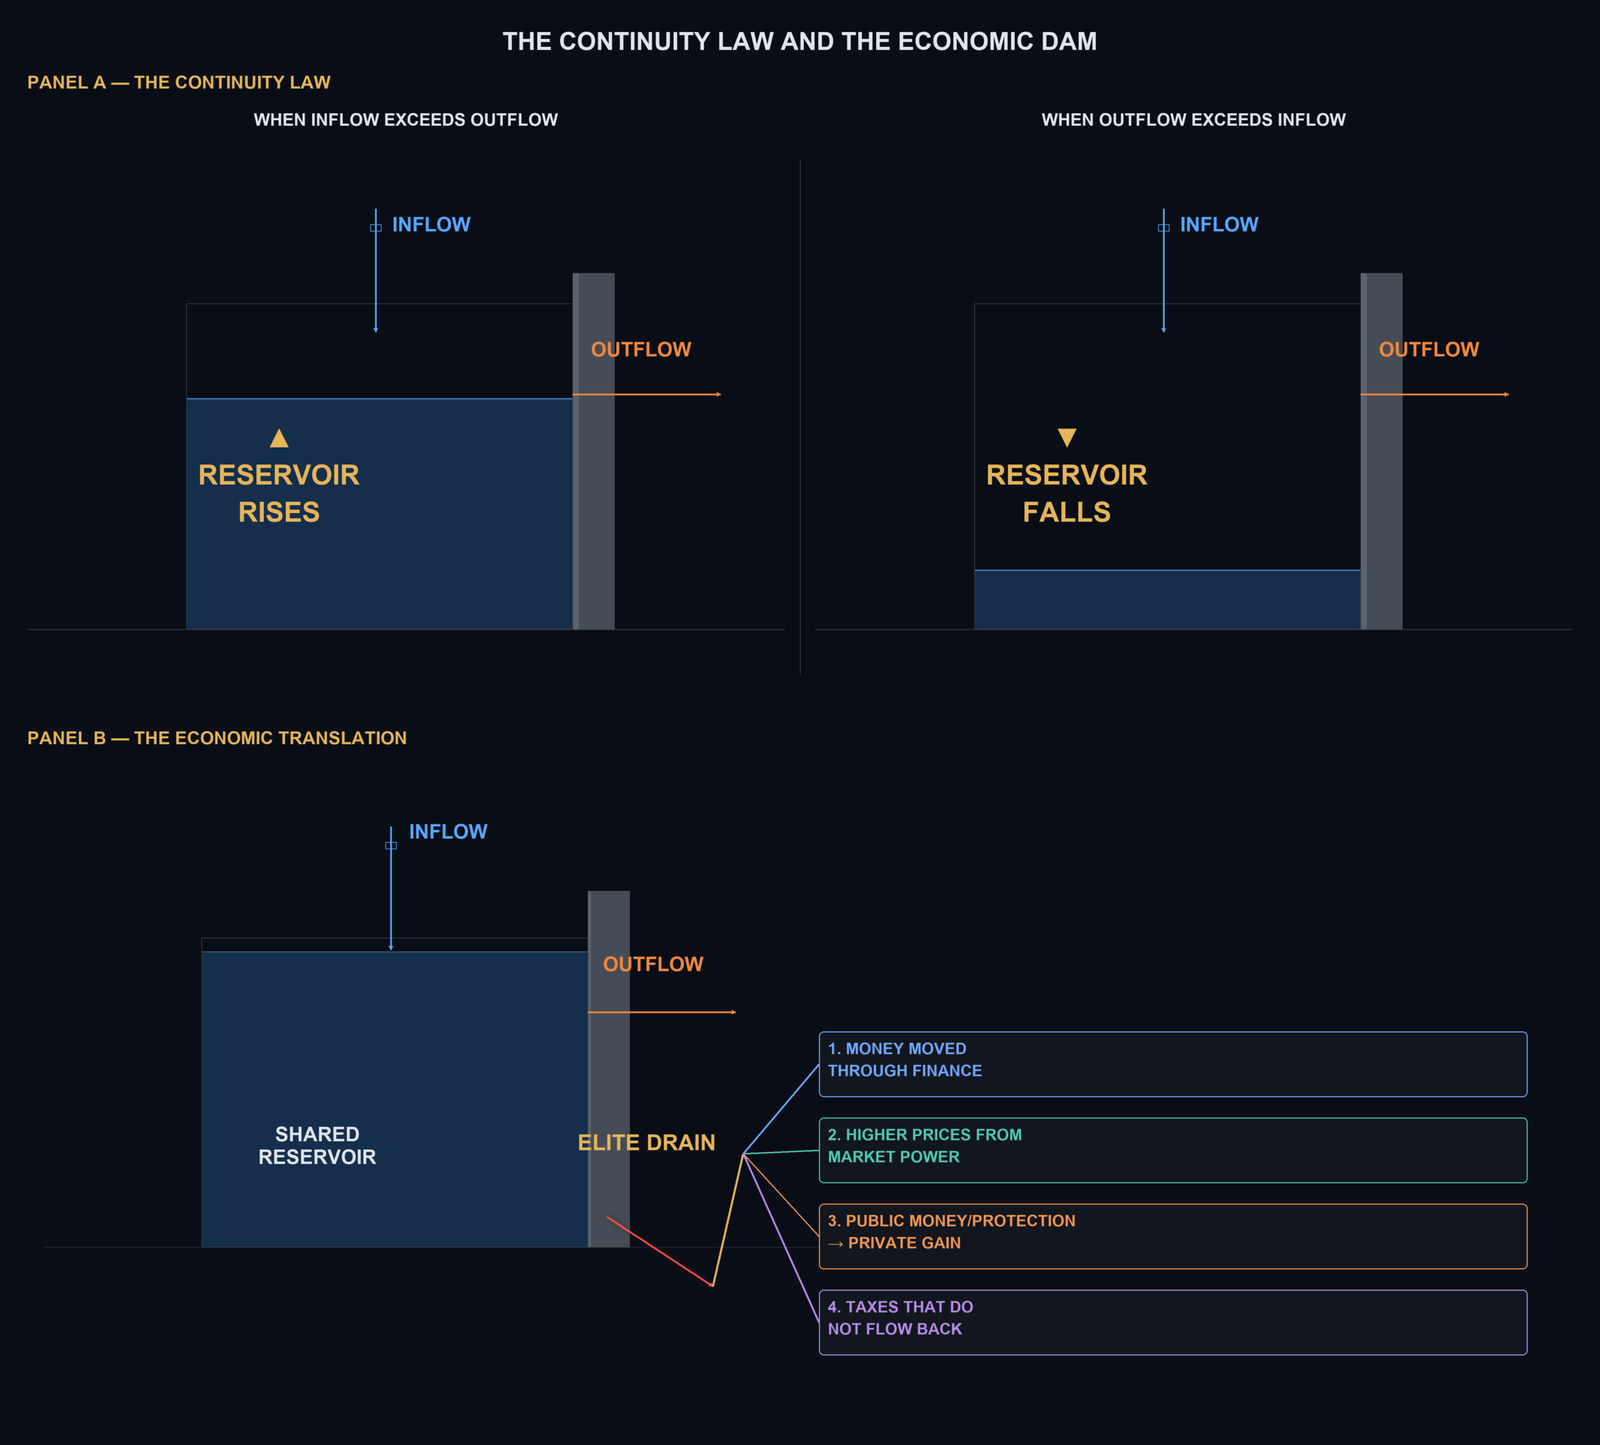
Component 1, the inflow. Water enters the dam from above through a valve. One important inflow is the tax code, especially the top marginal tax rate. Four flows refill the reservoir: wages, productive growth, public trust, and taxes. The top marginal tax rate is paid only on income above the highest threshold. In 1963, that rate was 91%. If $10 fell above that threshold, $9.10 returned to the public system. 90 cents remained. Today, the top rate is 37%. the same $10, $3.70 returns to the public system, $6.30 remains. The valve did not drift shut. Successive governments turned it down, first in 1964 and 1965, then much further beginning in 1980. The rate fell by 54 percentage points. Figure 2.3 carries this rate as the dashed line on both panels, and Figure 2.4 as panel 4.
Component 2, the outflow. exits through the outflow pipe, that is public spending. Schools, roads, defense, healthcare, research. This is not waste, this is maintenance. When you stop maintaining a dam, it cracks. When you cut public investment, future productivity falls. The debate about the outflow, how much to spend, on what, is a real debate worth having. But it is not the whole story. There is a third component and it is where the real action is.
The Elite Drain: Four Groups
That third component is the drain. The drain is not one channel, it's four main branches. Think of the economy as a shared pool that everyone's work and taxes fill together. It's supposed to flow back out to everyone. Wages, schools, safety nets. It doesn't leak by accident. Each of these branches is a rule someone built on purpose, quietly sending part of that shared pool toward a small group at the top, before it can reach anyone else. This drain has a name, the Elite Pipe.
The first branch moves money through the financial system. The second uses market power to charge higher prices. The third turns public money and public risk into private gain. The fourth stops part of the tax flow from returning to the shared reservoir. Each branch contains several channels. We'll take them one at a time.
Group 1 — money moved through finance. Company profit is moved toward shareholders, while repeated fees slowly reduce household savings. Three channels. Stock buybacks, financial sector excess profits, and fees on retirement savings.
1. Stock buybacks. A stock buyback is when a company uses cash to buy back and retire its own shares from the market. Buying back stock means fewer shares are left, so the same profit looks bigger per share, and the price tends to go up. The people who gain the most are the ones who already own the most stock, especially executives paid in stock options. This used to be legally dangerous. Insiders pushing up their own stock price, which regulators could treat as manipulation. In 1982, the Securities and Exchange Commission quietly created a new rule, Rule 10b-18, that gave companies legal cover to do this anyway. S&P Global reported in 2025 that S&P 500 companies spent $942.5 billion on buybacks in 2024 alone, a record.
2. Financial sector excess profits. Economist Thomas Philippon studied this question for years and reported in 2015, in the American Economic Review, that the cost of moving and managing people's money stayed roughly flat around 1.5 to 2 percent of the money involved for nearly a century, even as computers took over almost every part of the job. For a normal family this doesn't show up as one big bill. a small cost hiding inside a mortgage rate, a savings account fee, or an investment fee, small enough to miss in any single month, but steady enough to add up over a lifetime.
3. Fees on retirement savings. Managing people's savings is a real service, and a fair fee is not a drain. But fees are charged against the whole growing balance every year, so they compound just as the savings do. The U.S. Department of Labor gives this example. Raising the annual fee from half a percent to one and a half percent leaves the worker with 28 percent less money after 35 years. The drain begins when people pay more than the service is worth.
Group 2 — higher prices through market power. When competition is weak, a company can charge more. Patent rights can also turn publicly supported knowledge into private profit. Two channels, monopoly markups and publicly financed innovation with private patent rents.
4. Monopoly markup extraction. Jan De Loecker, Jan Eeckhout and Gabriel Unger reported in 2020 in the Quarterly Journal of Economics that the average markup U.S. companies charge above their own costs climbed from about 21 percent in 1980 to about 61 percent by 2016, nearly tripling in less than four decades. That extra money doesn't buy a better product or a better service. It's just a price you pay because you don't have another option. It falls hardest on families who spend most of what they earn on everyday things.
5. Publicly financed innovation with private patent rents. Under the Bayh-Dole Act, recipients of federal research money may keep patent rights. The law can help bring inventions to market, but the public may pay twice. First for the research, and then through a high exclusive patent price. Researchers led by Cleary at Bentley University, publishing in JAMA Health Forum, found that funding from the National Institutes of Health, Public Money, contributed to 354 of the 356 drugs approved by the Food and Drug Administration between 2010 and 2019, roughly 99%. That funding, from 2000 onward, totaled $187 billion. Then a patent gives a company the legal right to keep competitors from selling the finished drug for years. And with it, the power to set a high price. For a patient, that can mean paying twice, once through taxes that helped fund the discovery, and again at full price when they need the medicine.
Group 3 — public money and protection turned into private gain. The third group begins with a real public purpose. Government buys services, supports investment, guarantees loans, or rescues the economy. The drain is the extra private gain left when the public receives no fair return. Five channels. Defense markups. Civilian contracts. Business subsidies. Public credit. Crisis rescues.
6. Defense pipeline markups. This is when a small number of military contractors, with little real competition, charge more than a fair price for what they build. In 2019, auditors reviewed 47 aircraft spare parts sold by TransDigm, a defense part supplier. On 46 of those 47 parts, they found excess profit. The profit rates ranged from 17% to more than 4400%. A later audit found at least $20.8 million in excess profit across 105 spare parts. This is not an estimate for the whole defense budget. It is a documented example of what weak competition can look like when the military still needs the part and has few real alternatives. Every dollar lost to an inflated price is a dollar that should have bought real defense capability and didn't.
The war with Iran shows what those prices mean once the equipment is used. CBO estimated the war had cost the Pentagon $38.1 billion by 1 August 2026, more than half of it — $21.7 billion — simply replacing what had been fired. Those replacements are bought through the same pipeline, at the same prices. Since June 2025 the United States has used between one-half and two-thirds of its inventory of Patriot, THAAD, SM-3 and SM-6 interceptors, and rebuilding those stocks would take at least five years. Fourteen months to spend; five years to replace. The price per unit decides how many units a budget buys. Spending at these prices does not make a country stronger. It leaves it thinner. And that money was not raised in taxes: it arrives as debt, repaid later through taxes on wages or pressure on public programs.
7. Civilian contracts and private administration. Government needs companies to supply goods and services, and sometimes to run public programs on its behalf. The Government Accountability Office reported that federal contracts totaled $755 billion in 2024. About $310 billion went through civilian agencies, and 84% of those contract dollars were awarded competitively. Those figures show the size of the pipe, not the size of the drain. The drain begins where competition is absent, suppliers cannot be changed, or government pays more than the service is worth. Medicare Advantage is one example. MedPAC estimates that private plans received $84 billion more in 2025 than the same patients would have cost in traditional Medicare. Not all of that difference is profit. Some pays for extra benefits, but it shows why the public must check the return it receives.
8. Subsidies for private companies. A subsidy can build a factory, protect an important industry, or create jobs, so it is not automatically a drain. But the public needs something clear in return. Cailin Slattery and Owen Zidar, found that the average deal offered $178 million for 1500 promised jobs. Comparing the winning location with the runner-up, they found job gains in that specific industry, but no strong evidence of broader local economic growth. The drain is the public money lost, when promised jobs do not arrive, the investment would have happened anyway, or the company keeps all the gain without paying money back.
9. Public loans and guarantees. Government can make company borrowing cheaper by accepting part of the risk. In 2025, the federal government was expected to support $1.9 trillion in loans and guarantees. The normal budget method counted expected direct losses at $2.4 billion. The Congressional Budget Office's Fair Value Method also priced the market risk, like an insurer pricing a policy, and valued the cost at $65.2 billion. That does not mean taxpayers will lose $65.2 billion. It means the public is providing protection valued that highly. The drain begins when private owners keep the gain without paying a fair price for that protection.
10. Crisis rescues. Emergency support can stop a financial collapse and protect jobs, and some rescues are repaid. Through TARP, the Treasury put $245.5 billion into banks and recovered $275.9 billion, so that program was not a simple one-way loss. In 2020, the Federal Reserve promised support for the corporate bond market. New York Fed researchers found that the promise alone lowered borrowing costs across a market far larger than what the Fed actually bought. The public backing had real value. The drain is the part of that value private investors kept without paying the public for the protection.
Group 4 — taxes that do not flow back. The fourth group weakens the return flow. More income reaches the top, but less returns through taxes to refill the shared reservoir. Four channels. Companies paying zero federal tax. Offshore profit shifting. The capital gains preference. Top rate erosion.
11. Companies paying zero federal tax. This is when a highly profitable company uses legal tax breaks to bring its federal tax bill all the way down to zero. ITEP, the Institute on Taxation and Economic Policy, reported in April 2026 that at least 88 major U.S. corporations paid no federal income tax at all in 2025, despite a combined 105 billion dollars in profit. Had they paid the normal 21% rate, that would have been 22.1 billion dollars. Ordinary workers don't get this option. Their taxes come out of every paycheck automatically. When a profitable company pays nothing, someone else has to make up the difference, usually through more government debt, or pressure to cut the very programs regular families rely on.
12. Offshore profit shifting. This is when a company books profit earned in the United States in a foreign country with very low taxes instead. The EU Tax Observatory, a European research group that tracks international tax avoidance, reported in 2024 that the share of the world's corporate tax revenue lost this way has stagnated at about 10 percent, using data through 2022, even after a decade of reform efforts meant to stop it. The same research program estimates that about $1 trillion in corporate profits are shifted globally each year. Where that profit was earned by American workers and American customers, it doesn't come home to be taxed. Wages can't be moved offshore the way profit can.
13. Capital gains preference. This is the rule that taxes income from investments at a lower rate than income from work. The Joint Committee on Taxation, the official body that estimates the cost of tax rules for Congress, reported in December 2024 that this lower rate cost the government $236.8 billion in 2024, one of the largest tax breaks the government tracks. This isn't a hidden loophole, it's written directly into the tax code. Since most Americans live on wages, not investments, this benefit was built for a group most people simply aren't part of, no matter how hard they work.
14. Top-rate erosion. This is the decline in the top tax rate on the highest earners over the past 60 years. In the early 1960s, the top tax rate on the highest earners in America was 91%. Today, that rate is 37%. Figure 2.4 shows this valve closing as panel 4. The Congressional Budget Office, Congress's own independent, non-partisan number-crunching office, reported in January 2026 that over that same stretch of decades, the richest 1% share of the country's income before any taxes or benefits rose from 9% in 1979 to 18% in 2022. Think of this as the main valve controlling how much of the wealthiest Americans' income flows back to everyone else. As that valve has been turned down, decade after decade, less has come back in, and everyone else has had to cover a bigger share of what's missing through higher relative taxes or through debt that future generations will have to pay off.
Figure 2.2 maps the fourteen channels beneath these four branches.
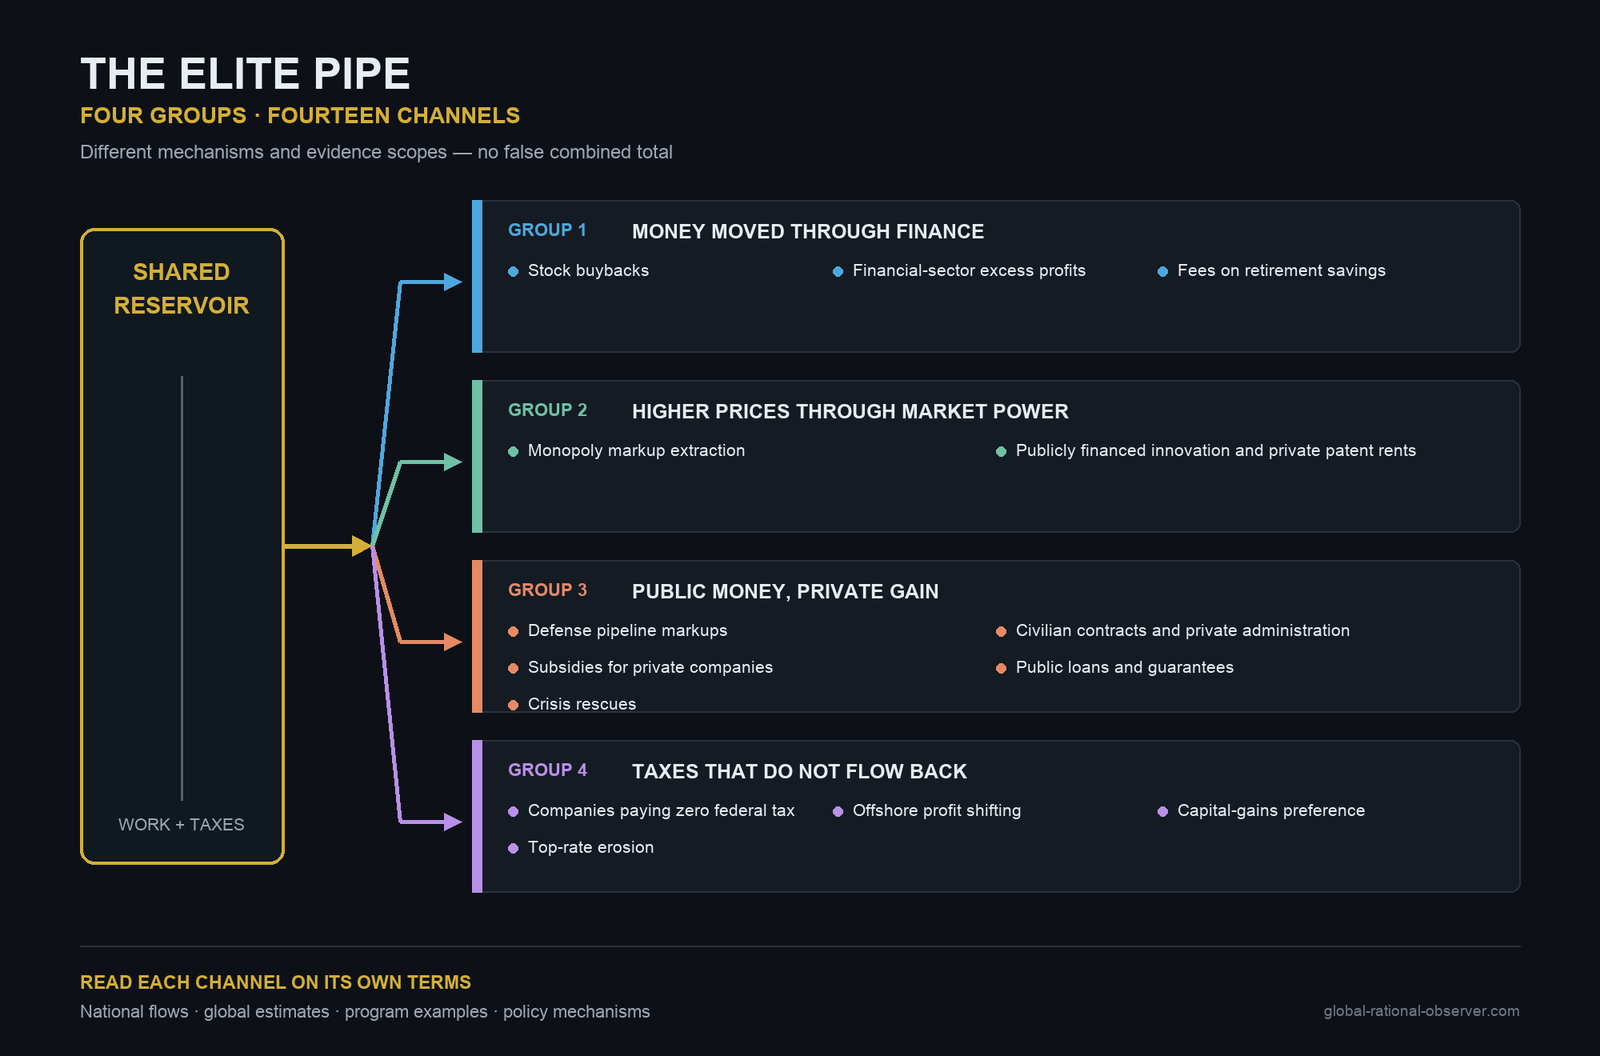
These channels do not work in the same way. Some move company profit toward asset owners. Some use market power to raise prices. Some turn public money, or public protection, into private gain. And some stop taxes from flowing back into the reservoir. Not every payment is a drain. A company may provide something useful and earn a fair return. The drain is the extra value that leaves the shared system and does not come back. After 14 channels, the pattern is clear. Some are measured directly. Some are mechanisms documented in the record. Some are policy choices that change who pays and who benefits. But together, they show the same direction. The flow is redirected before it reaches ordinary households and public capacity.
Debt: The Visible Result
Figure 2.3 compares the two high-debt eras and shows why the structure of inflow matters.
This chart puts the two debt episodes next to each other. Left panel after World War II. Right panel today. The left panel reached about 119% of GDP in 1946. In 2024, the debt ratio was about 122%. The 2024 level is not merely comparable with the World War II peak, it is slightly higher. Then the trajectories diverge. From 1946 to 1979, debt fell from about 119% to roughly 32% of GDP, with brief reversals. From 1980 to 2024, it rose from roughly 33% to about 122% despite temporary declines. The difference is not courage or discipline.
One major policy difference is visible in the second line on each panel. The dashed line is the top statutory marginal tax rate. Left panel, the rate stayed above 80% through the late 1940s. It stood at 91% through 1963, fell to 77% in 1964, then stayed at or above 70% from 1965 through 1980. Far higher than today. The debt ratio fell while the United States combined strong growth, progressive taxation and sustained public investment. The top rate applied only above the highest threshold, not to every dollar. But the highest slices of income were taxed much more heavily than today.
Right panel, the tax rate crashes from 70% in 1980 to 28% by 1988, cut in half in eight years. The long run debt trend then turns upward. Not every year. It fell during the late 1990s. and after the 2020 pandemic peak, but across the full period it rose from roughly 33% to about 122%. Then policy shifted. In 1990, President George H.W. Bush accepted a tax increase. The top rate rose from 28 to 31% in 1991. In 1993, President Bill Clinton raised it again to 39.6%. Those increases restored revenue. Combined with strong growth, spending restraint, and unusually high stock market tax receipts, the federal budget moved into surplus, and the debt ratio fell. Taxes were not the only cause, but restoring part of the inflow mattered. When those conditions changed, the upward debt trend resumed.
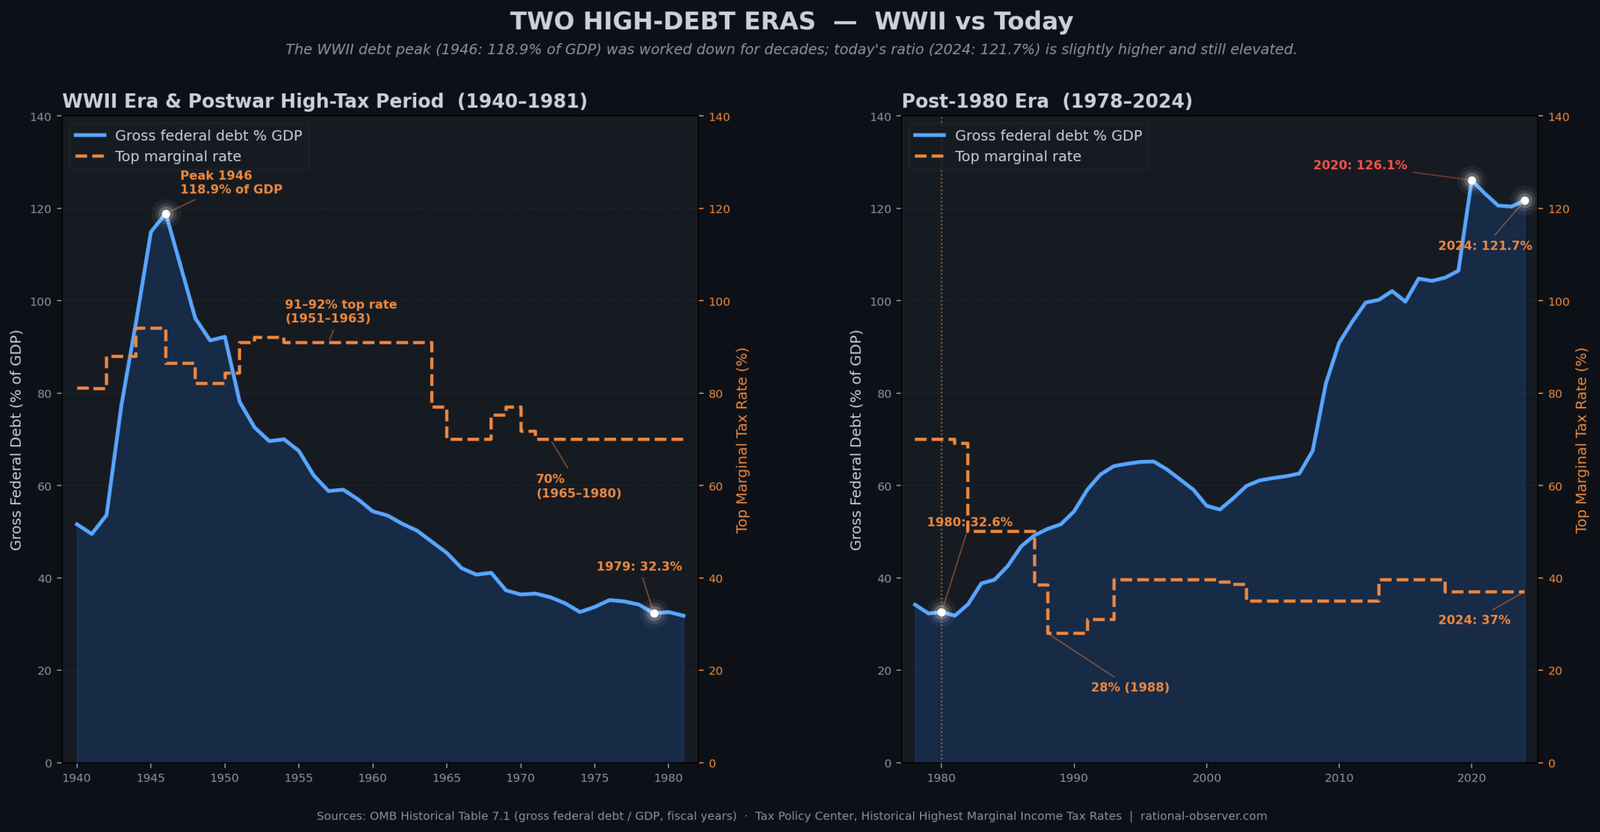
The top tax rate is one major difference visible here, not the only historical difference. Growth, inflation, spending, demographics, and America's global position also mattered. But the claim that high debt automatically prevents public investment is not supported by this history. The United States invested heavily, while the debt ratio declined. The debt level alone does not determine the outcome. The policy configuration matters.
Four Indicators
One measurement can be coincidence. Two can be chance. But when four independent measurements all stand on the wrong side of 1980 and keep moving against the system for 45 years, despite temporary reversals, that is a system shift. Watch the 1980 line. Figure 2.4 places the four indicators on a common historical timeline so their direction can be compared.
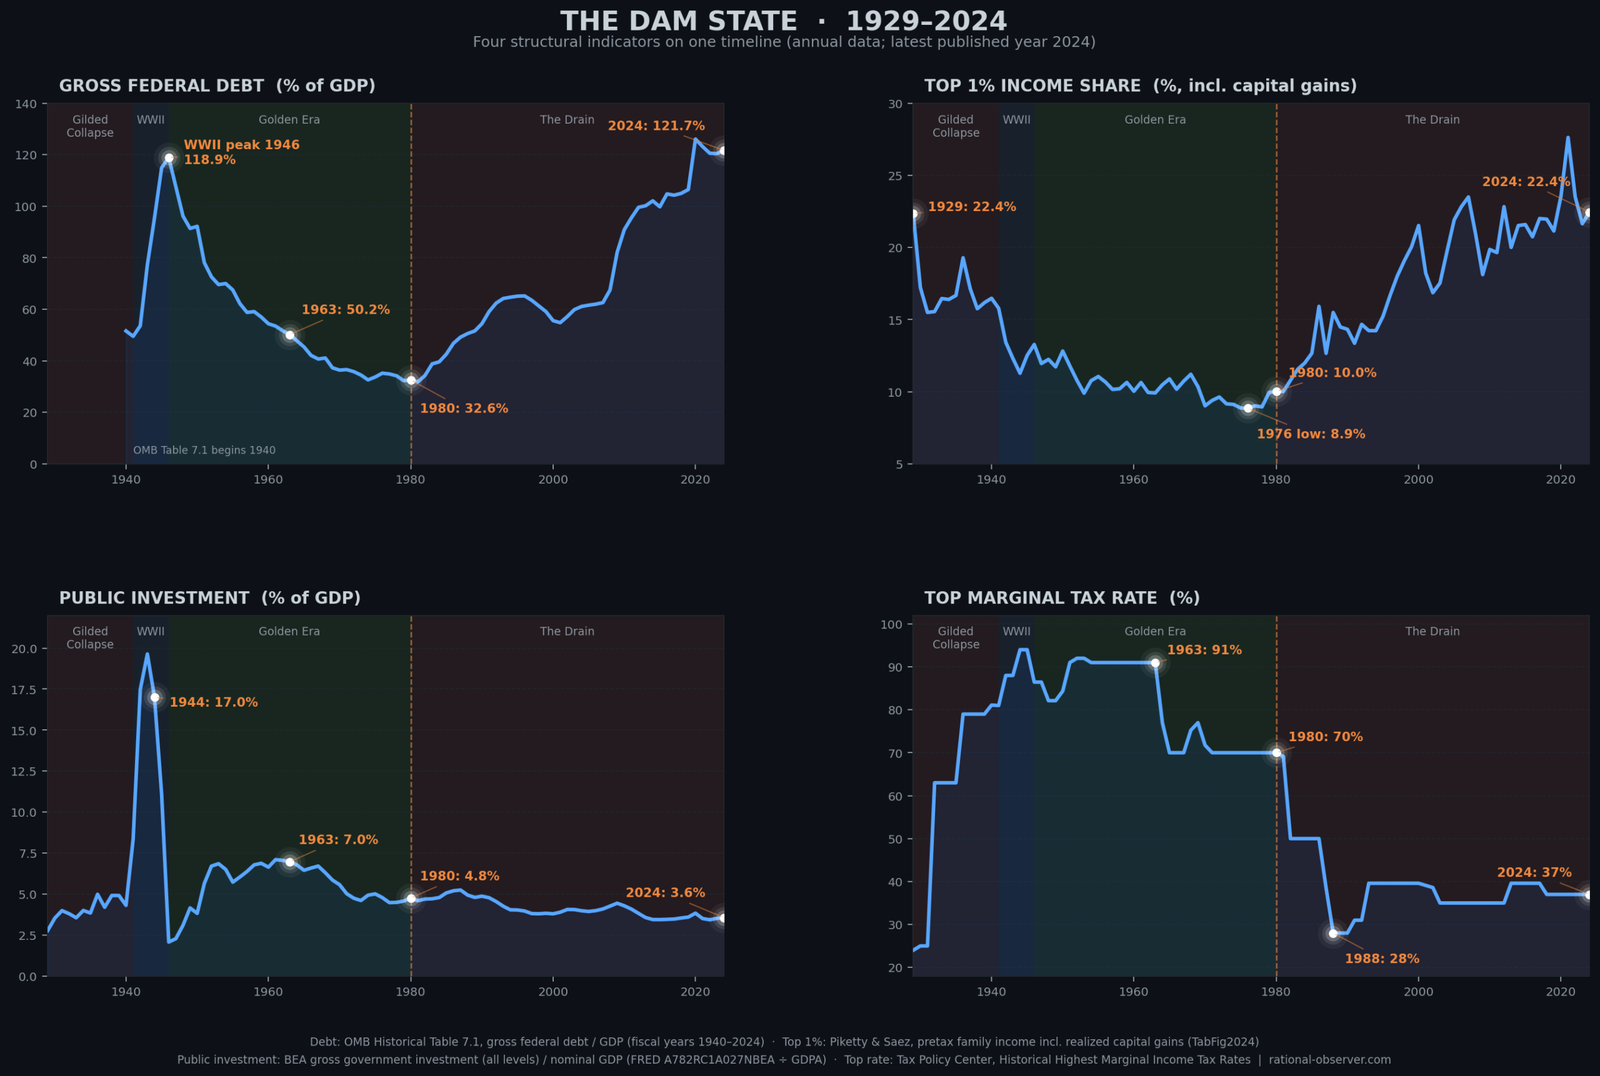
Panel 1. Government Debt. This is the water level in the reservoir. Left of 1980. Falling. From about 119% of GDP at the World War II peak in 1946 to about 33% by 1980. A 34-year decline. Right of 1980, rising to about 122% in 2024.
Panel 2, Top 1% Income Share. This is the size of the elite pipe. How much of the national income flows to the top 1%? Left of 1980, falling. From 22.4% in 1929 to about 9% by the mid-1970s. The lowest concentration of the entire century. Right of 1980, rising. back to 22.4% in 2024, exactly where it stood in 1929, the year before the Great Depression.
Panel 3, Public Investment as a Share of GDP. This is whether the dam is being maintained. Left of 1980 about 6-7% through the 1950s and early 1960s, 4.8% by 1980. Right of 1980 falling to 3.6% in 2024, among the lowest levels since World War II.
Panel 4, Top Marginal Tax Rate. This is the primary inflow valve, left of 1980, at or above 70% from 1936 through 1980. At 91% during the strongest decades of American economic growth. Right of 1980, drops to 28% under Reagan. Sits at 37% today.
In 1963, the dam was working. Debt was declining. Public investment was high. Income concentration was near its lowest point. The top rate was 91%. In 2024, the dam is draining. Debt is near its highest. Public investment is near its lowest. Income concentration has returned to 1929 levels. The top rate is 37%.
Designed, Not Accidental
None of this happened by accident. The stock buyback mechanism was created in 1982 when the Securities and Exchange Commission adopted Rule 10b-18. Before that rule change, companies that bought back their own shares risked prosecution for market manipulation. After it, the practice exploded. Corporate taxes were cut through deliberate votes in 1981, in 1986, and again in 2017. And the Bush tax cuts of 2001 and 2003 moved the same direction through the top income dividends, capital gains, and the estate tax. The promise was always the same. Lower taxes would produce investment. The measurable result, again and again, was more money flowing to shareholders, asset owners, and executives.
Each mechanism was designed, built, maintained. Each decision was made by people with power, in service of people with wealth, at the cost of people without it. These are not market forces operating freely. They are policy choices, written into law, one decision at a time.
Conclusion
If each mechanism was built, each mechanism can be changed. The World War II generation did not solve debt by cutting programs. They raised the inflow. The Golden Era 1946 to 1980 did not build the middle class by reducing investment. They taxed the wealthy heavily and put the money to work in the public economy.
The dam can be repaired, not by vague gestures toward growth, not by hoping the economy will fix itself, by specific, named, reversible policy choices. the top rate toward the levels that produced the postwar boom. Restore corporate tax receipts. Close the capital gains preference. Regulate stock buybacks. Close offshore profit shifting loopholes. These are not theories. They are not experiments. They are the conditions that existed during the decades when American prosperity was broad, sustained, and real.
The dam can be repaired. But not without understanding the mechanism. Not without naming the drain. Not without recognizing the difference between a debt problem and a drain problem. The question is not, can we afford to fix this? The question is, who benefits from the story that we cannot?
Sources
Every figure and channel in this article is sourced — OMB, BEA, CBO, the Joint Committee on Taxation, the Census Bureau, Piketty & Saez, GAO, peer-reviewed studies and others. Full citations, methodology notes, and the complete channel-by-channel evidence appear in the full monograph.
Continue the Series
This is Chapter 2 of America's Wealth Drain, Part I — The Drain at Home. See the Part I overview, or continue directly to Chapter 3: The Invisible Depression.
Written by Rational Observer Global.
Read Episode 03 →Topics: where does the money go · where American money goes · wealth drain · fourteen channels of extraction · stock buybacks · $942.5 billion buybacks 2024 · SEC Rule 10b-18 · financial sector profits · retirement fees · 401(k) fees · monopoly markups · market power · corporate profits · publicly funded drug research · NIH funded drugs · Bayh-Dole Act · drug patents · defense contractor markups · Pentagon spare parts · government contractors · Medicare Advantage overpayments · corporate subsidies · corporate welfare · government loan guarantees · bank bailouts · TARP · 2008 bailout · corporations paying zero federal tax · ITEP · offshore profit shifting · tax havens · capital gains tax · capital gains preference · top marginal tax rate · top tax rate 91% 1963 · tax cuts for the rich · World War II debt · WWII vs today debt · how America paid down WWII debt · public investment decline · infrastructure report card · public education funding · Social Security elderly poverty · top 1% income share · national debt · Bill Clinton · George W. Bush · America's Wealth Drain · four groups fourteen channels · elite pipe · four indicators 1929-2024 · federal debt to GDP · public investment share of GDP · 1963 vs 2024 · inflow and outflow · shared reservoir · extraction · elite extraction · debt narrative